In facilities operations the understanding of where the process is on a phase diagram can often help the engineer and operator avoid extremely embarrassing design and operating mistakes. The oil and gas industry is full of many “war stories” about “phase diagram disasters.” Most instances are never related back to the phase diagram misunderstanding. In one well-documented but poorly published case a “dry gas” pipeline that was pigged flooded miles of sandy beach. In another case thousands of kilowatts of compression power were installed to maintain the pressure of a reservoir above the dew point when in fact the reservoir was at a temperature above the cricondentherm. In many cases equipment manufacturers and purchasers of gas have specifications of “superheat” or dew point that have not been met and led to upset customers and/or millions of dollars of lawsuits.
One of the first issues to be resolved by a facilities engineer working in a gas plant or gas production facility is where is the process operating with respect to the phase diagram. A general knowledge, if not a detailed knowledge, will allow the design engineer and the facilities operator to make intelligent decisions that have significant impact on the profitability of a gas production facility.
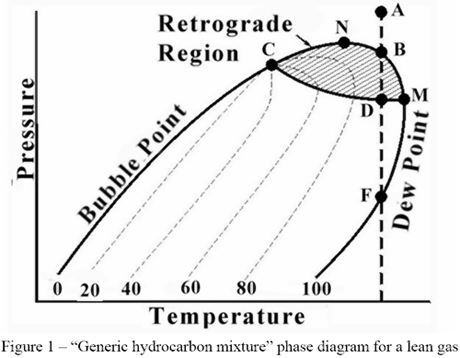
The following figure is a “generic hydrocarbon mixture” phase diagram for a lean gas. The area to the left of the Bubble Point line is the sub-cooled liquid region.
The area to the right of the Dew Point line is the super-heated gas region. Between these two lines the mixture is two-phase. Other areas of interest are the retrograde region and the supercritical region. Each of these regions provides advantages and disadvantages for operations.
This month we will start to define the points of interest so that we may choose proper operating points for various types of processes. The first point to define is the cricondentherm. The definition of this point is the highest temperature at which twophases (liquid and vapor for most processes) can coexist. In Figure 1, this is point M. Point M has considerable theoretical and practical importance. For example, if the cricondentherm for a sales gas (point M) is 0 ºC (32 ºF) cooling the gas to 4 ºC (40 ºF) at any pressure will not result in condensation of liquids. This type of operation is typically the type used for cross-country transportation of gas in pipelines. Operation with this type of system will not require “slug catchers” at the end of the pipeline and will significantly decrease pressure drop in the pipeline.
If the gas were processed in a cold separator such that point B (a dew point) was 0 ºC (32 ºF) problems could occur in the same conditions as the pipeline mentioned above. If the pressure of the pipeline was between the pressure of point B and F and the pipeline cooled to 4 ºC (40 ºF) there could be significant quantities of liquid in the pipeline. If the operations people were not familiar with the phase diagram they might increase the operating pressure of the cold separator and still keep the temperature at 0 ºC (32 ºF). This action would result in increased liquids in the pipeline, not decreased. However, if the cold separator was operated at the pressure of point M, at a temperature of 0 ºC (32 ºF), in theory there would be no liquids in the pipeline again. (More about the difference between theory and practice in future tips).
To learn more about similar cases and how to minimize operational problems, we suggest attending our G4 (Gas Conditioning and Processing) and G5 (Gas Conditioning and Processing – Special) courses.
Dr. Larry L. Lilly


Thank you for discussing very important topic. I just want to point out there are some minor discrepancies:
1. paragraph 4, line 4: ” For example, if the cricondentherm for a sales gas (point M) is 0 ºC (32 ºF) cooling the gas to 4 ºC (40 ºF) at any pressure will not result in condensation of liquids”. I am sure you mean heating the gas rather than cooling.
2. paragraph 5, line 1: “If the gas were processed in a cold separator such that point B (a dew point) was 0 ºC (32 ºF) problems could occur in the same conditions as the pipeline mentioned above. If the pressure of the pipeline was between the pressure of point B and F and the pipeline cooled to 4 ºC (40 ºF) there could be significant quantities of liquid in the pipeline” Inconsistent with the previous example and the values.
Thank you
I have enthalpy values for various hydrocarbon components on the US Governments NIST site in their Web Book and have compared these to the pressure enthalpy graphs found in the GPSA binder. They are significantly different. In some cases they were out by 100%. The critical point was the same for both and the delta H between the Vapour and Liquid curves were the same on the few I compared. The isobars, the isotherms and the specific volumes were wildly different.When I enquired about this I was told it was because of a “Reference Point”. This is where the explanation ended. If the Critical Point, normal boiling point and delta are fixed reference points, how can the other data points be so out of wack. If I have inlet gas and need to remove heat to pull out LPG, NIST says I need to strip out twice the heat to get to the vapour curve that the GPSA graphs show. Any suggestions on haow to get comparable volumes. Using Hysis is not an option I have.
It’s just a test.
the author is correct, cricondentherm is a typical specification for pipelines, with temperatures ABOVE cricoT you are sure that no condensation is possible,
see
http://www.prode.com/en/phaseenvelope.htm
you may download the free version and see yourself 🙂
30超えにもなってくると、肌のこめかみやおでこにシミやくすみ、そばかすが気になってきますよね。そんななやみに効果的なのが、シミ漂白石鹸「エンジェルプレミアマジックソープ」なんです。
混合された美白成分の効果で、洗うだけでシミやくすみが取れちゃうんだとか!
絶対一度は使ってみたいですね!
please,
what is the difference between hydrocarbon dew point and cricondentherm?