From Humble Unknowing Beginnings…
The fabrication of a U. S. Government Cargo Ship named the Marlene Hitch, delivered during July 1945 in Duluth MN, unknowingly issued in the groundwork for the world-changing commercial activities of exporting Liquefied Natural GAS (LNG) as a viable energy source. The vessel later renamed the Methane Pioneer, shown in Figure 1, was refitted for LNG transport, and designed to carry 5000 m3 (31,450 Bbls) of LNG equivalent to some 2,335 tonnes (110 MMscf).
Her maiden voyage was from Constock’s LNG production facility on the Calcasieu River in Louisiana, carrying the world’s first ocean cargo of LNG. It left port on 25 January 1959 and reached its destination at Canvey Island in England on 20 February, taking 27 days to cross the Atlantic Ocean.
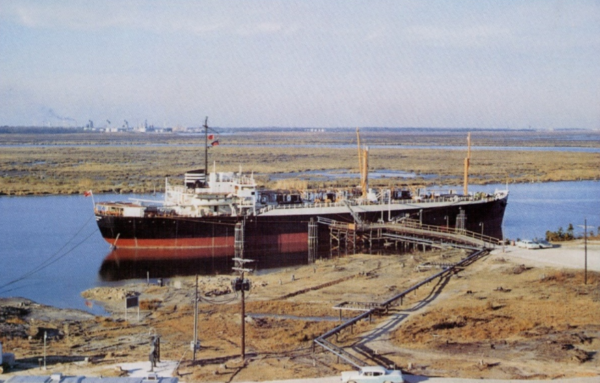
Figure 1. Methane Pioneer [1]
Since that time, the worldwide LNG Export/Import evolution has risen from an initial 10-50 million tonnes per annum (mtpa) during the 1970 – 1990 era to 100 mtpa by 2000 and doubling again by 2010 to 201 mtpa. By 2017 the worlds Energy demand for LNG had risen to some 400 billion cubic meters (14 130 billion cubic ft) equivalent to some 291 mtpa [2]. To put this into perspective, just 1 mtpa can provide roughly 7.2 billion kWh of energy (assuming a power plant conversion efficiency of 50%). That amount of energy could provide nearly 700 000 homes in the US their annual power requirements, assuming an average demand of 10 400 kWh [3].
Now, multiply those values by 291 to estimate the energy that was traded via LNG in 2017. LNG is a significant contributor in meeting the worlds energy needs. This is often referred to as the LNG Value Chain and is shown schematically in Figure 2. At the most basic level, base-load LNG is a transport business that allows natural gas to be sold from suppliers that have excess reserves/capacity to consumers that are lacking adequate natural gas resources to meet their energy needs.

Figure 2. The LNG Value Chain [4]
This industry is forecasted to continue to grow for likely the foreseeable future. A forecast from Shell to 2035 is provided in Figure 3. Note CAGR in Figure 3 is compound annual growth rate.

Figure 3. Global gas supply by source [5]
The future of LNG appears very promising; however, many limiting criteria are present including global energy prices, contractual structures, supply and demand issues. There is a changing landscape of new LNG gas sources, including the major capital investment decisions for new base-load liquefaction facilities that will be made likely in the next few years.
What is LNG???
LNG is natural gas that has had all contaminants (primarily H2O, H2S, CO2 and mercury, as well as heavy hydrocarbons) removed to allow for liquefaction at cryogenic temperatures. The LNG is stored and transported at roughly -160 ºC (-260 ºF) and atmospheric pressure. Depending upon the inlet gas composition to the liquefaction facility, and LNG supply contracts, the produced LNG will have a range of compositions and physical properties, from rich to lean as shown in Table 1.
Table 1. Example LNG Properties

Typical LNG composition is primarily lower molecular weight Paraffins, (C1 – C4), with small amounts of N2, and possibly C5 in some instances. The LNG composition that a country, for example, Japan, may prefer to purchase depends primarily on the local infrastructure requirements (power plants, residential, industrial needs, etc..). The composition of natural gas in utility grids around the world might range from lean to rich depending upon how the infrastructure was originally developed. In the United States, the natural gas industry started extracting liquids (NGLs) around 1910, thus the infrastructure has been developed to burn very lean gas as most of the liquids are removed to sell in the hydrocarbon liquids commodity market. In other locations, there is a limited demand for the liquid hydrocarbons, so in these instances, the gas in the national grid tends to be richer in heavier hydrocarbons. Some example of global specifications for LNG import is shown in Figure 4. If the composition of the contracted LNG supply does not meet the countries heating value requirement, the regasified LNG can be blended with heavier hydrocarbons or nitrogen at the receiving terminal.

Figure 4. Example LNG Heating Value Specifications [6]
International Natural Gas Trade and LNG – how are they related?
LNG is an integral component of the worldwide natural gas trade. In 2017, roughly 30% of the worlds’ natural gas consumption (3 680 x 109 std m3/year (355 Bscfd)) was traded internationally (via pipeline or LNG), and 35% of the international trade was by LNG (393.4 x 10⁹ std m3/year (37.9 Bscfd)). Therefore, it is reasonable to review in some detail the status of the regional Natural Gas Reserves, Production, and Consumption on this cited world basis.
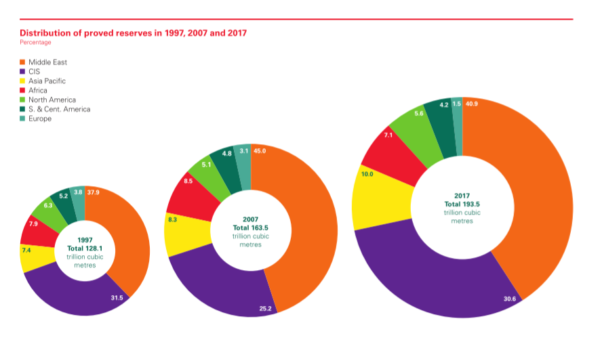
Figure 5 [1] indicates the evolution of natural gas worldwide reserves from 1997 to 2017. Notice that the decade increases remains rather steady, and the total reserves as of 2017 is approximated to be some 193.5 trillion cubic meters (TCM) (6 832 trillion cubic feet, TCF). The Middle East is a leader in reserve figures as documented, with the US only accounting for some 8 737 billion cubic meters (308.5 trillion cubic feet).
Figure 5. Distribution of proved reserves from 1997 – 2017 [1]
There is considerable disagreement with this figure amongst experts, with some arguments that there may be discord by a factor of at least tenfold more gas within the US than reported.
Considering the surging access shale gas plays, as well as unconventional (tight) gas reserves and potential coal bed methane (CBM), coal seam gas (CSG), the actual amount of natural gas in the U.S. may be difficult to accurately account for. This is an important subject to consider; however, for the U.S. Natural Gas Reserves and Supply are perhaps understated in these figures.
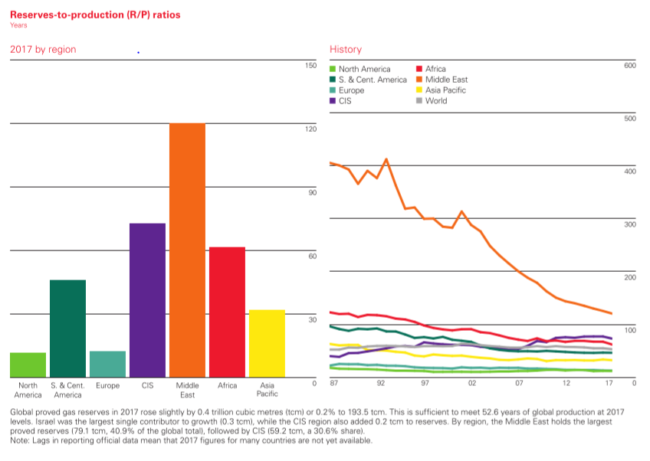
A key indicator of natural gas energy usage efficiency is to follow a region (Countries) Reserves-to-Production Ratio. This will provide an indication on the ultimate longevity of sustainable gas production. The higher the Reserves-to-Production ratio, the longer sustained production can be supported.
Notice that Figure 6 indicates a vastly different position of the North American Continent in terms of Reserves-to-Production Ratios as compared to Russia or the Middle East. The Middle East reaches an admirable ratio of some 120, whereas N. America is below 10. Canada’s reserves amount to some 66 – 67 TCF (1.87 – 1.90 TCM), so their position essentially coincides with the U.S. status. These Natural Gas Reserve figures have not differed greatly over the last 5 years, indicating that U.S. continental Gas “finds” have equaled a production withdrawal comparable to some 708 – 736 BCM (25-26 TCF) per year.
Figure 6. Global Reserves-to-Production Ratios [1]
A countries production and consumption of natural gas can highlight the impact that natural gas plays in providing sustainable energy for the population. U.S. natural gas statistics is provided in Table 2. The U.S. is the world’s largest producer and consumer of natural gas. The U.S. consumes approximately 20 % of the natural gas produced worldwide, while the North American energy source (RESERVES) is quoted as less than 5 % of the World. This data begs the question, is the North American reserves a valid estimate? Only time and exploration/production criteria and data will resolve this question.
Table 2. U.S. Natural Gas Statistics [1]

Another way to look at the natural gas trade is shown in Figure 7. Gas exporting countries are represented by red dots if they export via LNG, blue dots if they export via pipeline and yellow dots for countries that export via LNG and pipeline. If you draw a diagonal line from the upper left-hand corner to the lower right-hand corner, you will note that the gas exporting countries are generally in the upper right-hand area of the graph and gas importing countries are in the lower left-hand portion. The x-axis shows the size of the resource in each country and the y-axis shows the availability of that resource for export.
Figure 7. Natural Gas Reserves/Consumption vs Reserves Globally 2016 [1]
In summary, Figures 5 through 7 show the comparison of the global production/consumption and gas reserves. Table 3 provides the 20 largest natural gas consuming and producing countries in 2017.
Table 3. Top 20 Natural Gas Producing and Consuming Countries 2017 [1]

How does this statistical data relate to the world market for LNG? In short, it provides the global landscape of natural gas-rich countries that export vs. those which are dependent upon natural gas imports. It also gives insight into the drivers for the U.S. to enter into the LNG international business.
The U.S. shale revolution resulting in very low local natural gas prices (excess supply), and restricted, or non-existent pipeline capacity access to energy-lacking markets, made investing in U.S. LNG export facilities a serious investment consideration! Historically LNG has been sold worldwide on an equivalent energy basis cost with the sale of crude oil, often referred to as the Japanese Crude Cocktail (JCC). However, with the emergence of the U.S. as a major LNG supplier, new, creative commercial agreements are coming into play. Regardless, the value of natural gas in Germany, UK and Japan (importing countries) is significantly greater than the current value of natural gas in the U.S., thus a significant uplift in value can be recognized in exporting LNG.
Figure 8. Historical Trend for Natural Gas Prices Based on Energy $/MMBtu ~ $/Mscf [1]
As shown by Figure 8, the 2017 cost of natural gas in Japan was in the 7.50 – 8.00 $/MMBtu range; the similar cost also for other major importers such as China, and South Korea. The import price to Europe was roughly 5.80 $/MMBtu. In that period. Crude oil prices were in the 45 – 55 $/Bbl range. The value of natural gas in the U.S., based on Henry Hub (Gulf of Mexico) pricing index, remains less than 3 $/MMBtu.
With that said, there has been significant and continuing investment in U.S. LNG export facilities.
The New Kid on the Block – U.S.A.
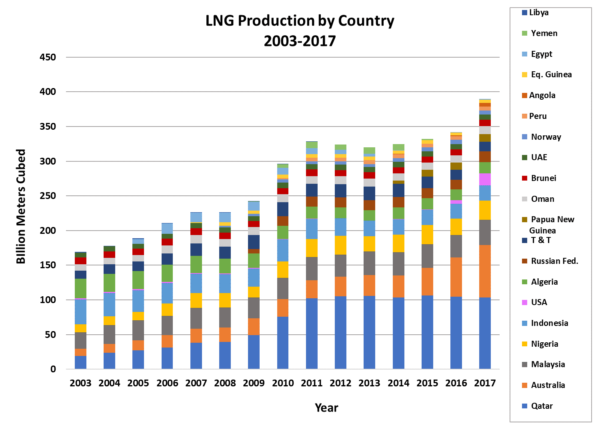
There are 21 export facilities for LNG throughout the world. The LNG production by country is provided in Figure 9. Qatar is the leading nation with some 103.5 BCM (76.6 mtpa), assuming a conversion of 1350 std m3 /tonne. The seven leading nations (Qatar, Australia, Malaysia, Nigeria, Indonesia and the U.S.) dominate exports with some 298.9 BCM, or 221 mtpa. The U.S. has reached an important international role as number six in the leading group with 17.4 BCM of equivalent gas exports, or approximately 12.5 mtpa in LNG.
Figure 9. LNG Production by Country [1]
The decision by the U.S. to aggressively enter the LNG export market has been phenomenal. Assuming that the natural gas supply in the U.S. will continue to grow, thus maintaining a 3 $/MMBtu local price, the value added to the Natural Gas is spectacular when sold overseas. For example, consider the U.S. production to produce the cited 12.5 mtpa is approximately 600 billion cubic feet (BCF) per year or 1.64 BCF/d. This is only a minor fraction of the U.S. production/consumption of some 71 BCF/d. Making the simplifying assumption that U.S. LNG has a heating value of 1000 Btu/scf, one can quickly estimate the uplift of selling the gas as LNG. The net value “added”, to the sale of 1,640,000 thousand cubic feet (MCF)/d at a net differential of say 5.5 $/MCF ($8.50 avg. worldwide vs. 3.0 $/MCF Henry Hub) generates 9 million dollars per day by the three existing export facilities. The added benefit seems well justified! However, it should be noted that quoted value does not include CAPEX, operating costs, and shipping fees, yet highlights the significant potential for profit for these facilities.
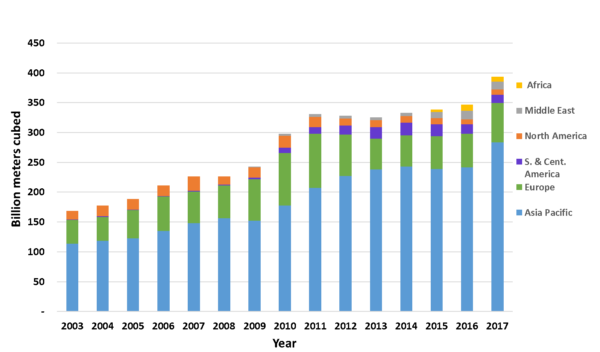
Some 24 Countries around the world are net importers of LNG. In 2017, the major consumers were Japan with 113.9 BCM (84 mtpa), followed by China at 52.6 BCM (39 mtpa), South Korea at 51.3 BCM (38 mtpa), and India at 25.7 BCM (19 mtpa). The summary of LNG importers is provided in Figure 10. The LNG market is significant, and estimates for continued growth, while viewed with caution by some experts, is still considered very positive for the future.
Figure 10. Global LNG Imports [1]
A Review of Existing, and Proposed Import/Export Terminal Facilities in the Continental US
As shown by Figure 11, as of 2018 there are 12 existing import terminals within the Continental U.S.. During 2018, there were two operational export terminals that include Cove Point. MD, and Sabine Pass, LA. The net capacity of these facilities amounts to some 3.8 BCF/d. However, only 1.56 BCF/d were processed to yield the 2017 export level of 12.5 mtpa. There is an obvious additional net processing ability in these facilities, and projections for these could reach almost 4 BCF/d. As shown by the Figure 11, the US is in an extremely unique position to greatly increase its LNG export position in the world. There are 9 additional facilities approved for export modifications to convert the import terminals to exporting facilities. The amount of time and expense it takes to modify an existing import facility to an export facility is significantly lower compared to a greenfield LNG project.

Figure 11. LNG Terminals in N. America [7]
Figure 12 provides the anticipated U.S. LNG export capacity from the Energy Information Administration (EIA). To compare fast growth of US LNG export capacity with others, for example, Australia, let’s take a look at the projected growth of Chenier’s Sabine Pass Facility. Train 6 of Sabine Pass just cleared the FID (Final Investment Decision) decision earlier this year. Once completed, each of the 6 trains has 4.5 mtpa capacity, resulting in 27 mtpa net exporting capacity of LNG for Sabine Pass alone. The North West Shelf of Australia (one of the largest and older LNG export facilities in Australia), produces 16.3 mtpa of LNG. The Sabine Pass Facility will dwarf the production of the North West Shelf when completed and running at full capacity. As can be seen in Figure 12., the U.S. is forecasted to expand LNG export capacity rapidly and could likely become the 3rd largest LNG producer in the world by 2021. One has to ask, is this a wise move at this time in the historical world trade of Oil, Gas, NGL, and LNG trade? These decisions include many “unseen” factors that consider critical economic/political/industrial relations between the U.S. and other countries seeking the same leader position in LNG trade.
The LNG worldwide trade is very complex. Nevertheless, the U.S. has a unique position of flexibility. Many decisions must be made, but the unique industrial capacity is present. In many ways, the U.S. has become the sleeping giant of LNG that has yet to recognize its full potential.

Figure 12. U.S. LNG Capacity, Company Investors Presentation [8]
To learn more about LNG, we suggest attending our G2 (Overview of Gas Processing), G29 LNG (Short Course: Technology and the LNG Chain), and G4 LNG (Gas Conditioning and Processing-LNG Emphasis) courses.
Written By: Dr. Frank E. Ashford
Kindra Snow-McGregor
References
1. Reprinted with permission, American Oil and Gas Historical Society
2. BP – Statistical Review of World Energy, 2018 (for 2017)
3. US Energy Information Administration, Frequently Asked Questions
4. Short Course: Optimising Terminal and Ship Operations, John A Sheffield, 2018.
5. Shell LNG Outlook 2019
6. Coyle, D., de la Vega, F., Durr, C., “Natural Gas Specification Challenges in the LNG Industry”, KBR, Paper PS-47.
7. FERC, https://ferc.gov/industries/gas/indus-act/lng/LNG-existing.pdf
8. U.S. Energy Information Administration, company investor presentations, Dec. 2018.
9. Statista Research Department, 2019.
10. G-29 “LNG Short Course: Technology and the LNG Value Chain”, ©PetroSkills | John M Campbell, 2019.
Sign up to receive the Tip of the Month directly to your inbox!

