Why NPSHR Changes With Impeller Diameter?

Introduction

Confusion sometimes results when reviewing published NPSHR curves.  This is especially true when faced with trimming the impeller diameter to match changing operating conditions.  A well known fact is that the head-flow relationship varies with the diameter.  This can be accurately approximated by the affinity laws.  However, what happens to the NPSHR-flow relationship when the diameter changes?  This relationship is frequently over looked and can lead to pump cavitation.  This Tip of the Month examines the relationship of NPSHR to the impeller diameter and clarifies other misconceptions regarding pump NPSHR curves.

Background

Pump performance may be shown for a single impeller or a range of impeller diameters.  In the latter case the pump performance may be shown as multiple curves from the maximum to the minimum diameter, and may show several intermediate impeller sizes.  In addition, the pump performance characteristics may show curves for NPSHR, efficiency and required power.   The representation of the pump performance varies widely depending on many factors and can lead to design errors and possible confusion.

An example of a typical pump performance curve frequently seen in publications is shown in Figure 1.  The pump flow rate is plotted on the horizontal axis, and the head and NPSHR curves, which are a function of flow rate, plotted on the vertical axles.  Note that a single-line NPSHR curve starts at the no-flow condition and continually rises to the maximum flow rate.  For several reasons that will be discussed later, this type of NPSHR curve is incorrect and can lead to design errors and possible cavitation problems.

Pump cavitation is a complex subject and the topic of many technical papers and books.  However, it is widely accepted that this phenomenon begins at the pump inlet.  It basically results from the increased velocity and reduced pressure as the fluid enters the impeller.  If the fluid static pressure drops below the vapor pressure, gas bubbles form and later collapse as the fluid flows along the impeller vanes.  These vapor bubbles can have a significant effect on the head produced by the pump.

It is important to note that fluid temperature also plays an important part in pump cavitation.  Obviously, the fluid vapor pressure will vary with temperature.  The fluid temperature will also vary with pump efficiency.  Temperature rise due to pump efficiency is not significant in the high to mid-range flow rates, however, can be very significant at low flow rates.  This is why pump NPSHR values are not given at low flow conditions.

Figure 1

Figure 1 – Pump Performance Curve for a Range of Impeller Diameters

Another important factor in pump cavitation is the fluid velocity.  Fluid entering a pump will continually increase in velocity as it passes to the impeller eye.  This increase in velocity causes a drop in the fluid static pressure and is analogous to lift on an airfoil.   At high to mid-range flow rates the incoming fluid velocity and the impeller rotational velocity are compatible and contributes to stable flow through the pump.  However at low flow rates the entering velocity is well below the rotational velocity and may cause the fluid to “recirculation” at the impeller inlet.  Fluid recirculation is another form of pump cavitation.   This is another reason why NPSHR is not given at low flow rates.

NPSHR Testing

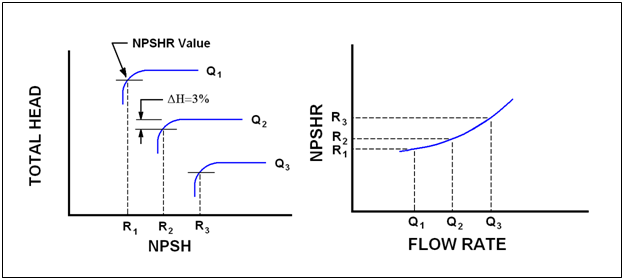
Understanding how NPSHR tests are conducted and how the impeller diameter influences the produced head will help eliminate confusion and possible errors.  Pump manufacturers determine the characteristic shape of the NPSHR curve for each impeller through carefully controlled shop testing, hydraulic modeling and computer simulation.  Hydraulic Institute Standard 1.6 gives strict guidelines for conducting shop testing and is used by most pump manufactures.  Pumps are normally connected to closed-loop piping circuit where water flows from a suction tank (or sump) through the pump and then back to the tank. The discharge flow rate, temperature and pressure are carefully measured and controlled throughout the test.    Basically the test is conducted at a fixed flow rate and speed while the suction pressure is reduced.   By reducing the suction pressure a point is reached when the water begins to vaporize thus causing the pump to cavitate.  The characteristic “cavitation” point is the flow rate that is exhibited by a small drop in head.  The test is conducted again at another fixed flow rate and again the resulting suction pressure and flow rate value are recorded at the “cavitation” point.  Once the series of tests are completed, a smooth line is drawn through the recorded data and plotted.   Figure 2 illustrates a typical series of test results and the resulting NPSHR curve.

Figure 2

Figure 2 – NPSHR Test Curve

A pump cavitation point can be difficult to define.  The formation of vapor bubbles is a gradual process, starting slowly and increasing with flow rate.  The API-610 defines the cavitation point as a three percent drop in head.  This is not to say that pump cavitation does not occur at smaller values, it is just difficult to accurately measure at smaller values.     To obtain a single point it is necessary to run a pump for a period of time and allow the testing circuit to stabilize to the reducing suction pressure.  Remember, vapor bubbles are forming and instruments need time to react to the fluid dynamics.

Impeller Diameter and Head Relationship

Larger pump impellers produce greater values of head for a given speed.   This is because the head is proportional to the tip speed.  The relationship of head to tip speed can be approximated by Equation 1.

Equation 1

(Eq. 1)

Tip velocity can also be related to impeller diameter and rotating speed by Equation 2.

Equation 2

(Eq. 2)

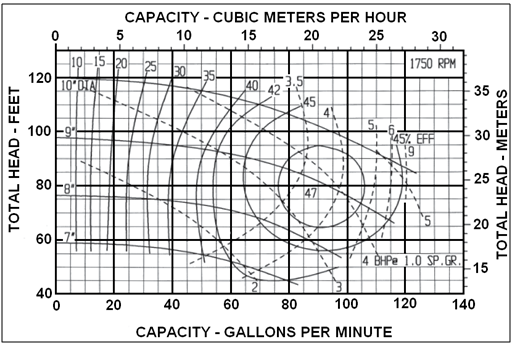
From Equations 1 and 2 it can be seen that changes in impeller diameter will have a direct effect on the pump head.  For example, reducing the impeller diameter will lower the pump head by a factor of four.   Since the cavitation point is identified by a three percent drop in pump head, it is logical that any change in impeller diameter will have a direct effect on the NPSHR value.  For this reason, most pump manufacturers provide a single NPSHR curve for a given impeller diameter.  Figures 3 and 4 are typical pump performance curves for a range of impeller diameters.  Note that a separate NPSHR curve is given for each diameter.

Figure 3

Figure 3 – Typical Pump Performance Curve for a Range of Diameters

Figure 4

Figure 4 – Optional Pump Performance Curve for a Range of Diameters

Conclusions

The following conclusions can be reached from the previous discussion.

  1. Each impeller will have a characteristic NPSHR curve.  It will depend on many design factors including the diameter.
  2. At a given flow rate, the NPSHR increases as the impeller diameter is reduced.
  3. The NPSHR is never tested at the shut-off point.  The fluid temperature continually rises as the flow rates decreases.  This prevents the system from stabilizing sufficiently to obtain accurate measurements.
  4. Pumps may cavitate at low flow rates due to recirculation of fluid at the impeller eye.
  5. The shape of the NPSHR curve is a U-shape.  There is a slight rise in values as the flow is reduced and again at higher values.  The NPSHR is lowest in the mid-range values.

By: Joe Honeywell

Legend

A          Conversion constant = 720 ft/sec (600 m/s)

D          Impeller diameter, inches (cm)

H          Total pump head, ft (m)

g          Gravitational constant, 32.17 ft/sec2 (9.81 m/s2)

n          Rotational speed, rev/min

V          Impeller tip velocity, ft/sec (m/s)

References

  1. American Petroleum Institute Standard 610, Centrifugal Pumps for Petroleum, Petrochemical and Natural Gas Industries, 10th Ed.
  2. Hydraulic Institute Standard 1.6, Centrifugal Pump Tests, 2000
  3. Terry Henshaw, Pumps and Systems, May 2009

34 responses to “Why NPSHR Changes With Impeller Diameter?”

  1. Abhijit Raje says:

    Dear Joe,

    I am quit impressed to read your papers & hope you will assist us in future too.

    Regards & Tanks,

    Abhijit Raje

  2. AROL RICHARD says:

    04 November, 2012

    Dear Joe,

    Your statement,

    “A well known fact is head – flow relationship varies with diameter.
    ( AGREED ).

    ” This can be accurately (?) approximated by affinity laws
    ( I DO NOT AGREE )

    All reputed manufacturers, factory test the Head-Capacity curves of their trimmed impellers and only then publish these curves for the respective diameters. More importantly,these trimmed tested curves are not parallel to each other, because the vane discharge angle increases with trimming and the curves are steeper. Will appreciate your comments.

    Regards,

    Arol Richard

  3. There is no more.

  4. I neededd to thnank you for this excellent read!!
    I definitely lovd every biit of it. I have got you book-marked to check out new things yoou post…

    Also viit my web bog stamped concrete

  5. Richelle says:

    Fantastic sikte you have here but I was curious if you knew of any message boards
    that cover the same topics discussed in this article? I’d really like to be a part of online communiity where I can get
    feedback from other knowledgeable individuals that share the same interest.

    If you have any suggestions, please let me know. Kudos!

    my blog – stamped concreete nh – Richelle,

  6. Dear Joe,
    Excellent paper.
    I have one issue where I cannot get a clear answer.
    How does NPSHr vary for density i.e. the NPSHr curve is always established on water – does it change if the pump is used for a lower density fluid and if so how does the NPSHr curve change?
    Aitken

  7. I really like what you guys are up too. This sort of clever work and reporting! Keep up the awesome works guys I’ve added you guys to my blogroll.

  8. Mittlerweile gibt es viele günstige Varianten der Tablette,
    doch die Bezeichnung Aspirin ist Synonym für den gesamten Markt geblieben.

  9. RAKESH PATEL says:

    Dear Sir I have sarch sewage pump immpeller of how to calculate diameter& hight please answer me.

  10. rakesh patel says:

    Dear Sir I have sarch sewage pump immpeller of how to calculate, formula diameter& hight please answer me.

  11. Dort werden die Erkrankten rund um die Uhr betreut und erhalten bei Bedarf eine künstliche Ernährung
    um den Körper zu stabilisieren.

  12. twitter.com says:

    Daher können Patienten mit zu hohen Blutdruckwerten aufgrund von Übergewicht die Ursache
    selbst bekämpfen, indem sie abnehmen.

  13. Nehme jetzt leider regelmäßig Medikamente und bin trotzdem dabei, meinen Lebensstil zu
    ändern.

  14. Die besten Tipps, die leckersten Rezepte und die spannendsten Erfolgsstories gibt es
    auch per E-mail.

  15. YILMAZ says:

    Dear Joe’

    Thank you for information. I need design high flow rate and high pressure centifuruge pump. pressure will be 400 psi and flow rate will be verh high (i.e. 20.000 gpm). How can I determine the RPM and size of impeller?
    Do you have any formula? I just need just draft numbers?

    Regards..

  16. Am stärksten sank der Blutdruck bei den Teilnehmern,
    die vor dem Versuch einen oberen Wert von 129 mmHg hatten – nämlich um durchschnittlich
    13,2 mmHg.

  17. Dpa/Deutsche See Fischmanufaktur Lachs enthält viele gesunde Omega-3-Fettsäuren.

  18. Und diese Rückkoppelung nach dem Motto „Meine Herde ist noch da könnte lebensrettend sein.

  19. Stan says:

    Schon sechs bis zehn Gramm dunkle Schokolade (Kakaoanteil mindestens 70 Prozent)
    pro Tag können den Blutdruck senken.

  20. Durch sportliche Betätigung vor allem im Ausdauerbereich sind positive Auswirkungen auf den Blutdruck nachgewiesen und nicht
    zu verachten.

  21. twitter.com says:

    Je zwei Knoblauchzehen, Zwiebeln und Zitronen mit
    der Schale schneiden und in einem Liter Wasser acht Minuten kochen lassen.

  22. Medikamente Wer mit Medikamenten den Blutdruck senken muss, sollte sie genau nach Verordnung einnehmen, nie auf eigene Faust anders dosieren.

  23. Eine gesunde Ernährung sollte daher an die persönlichen Wünsche und Bedürfnisse angepasst werden.

  24. Rappeur says:

    Hallo, Ihr Blog Thema zeigen sich nicht richtig auf dem Web-Browser NecroPedoSadoMaso 42 von SEWER… Es kommt wahrscheinlich aus dem WordPress-Theme oder Plugins. https://mmodeutsch.wordpress.com/2016/06/07/untoter-paladin-die-besten-world-of-warcraft-klasse/

  25. agrawalrk says:

    Can you answer to my query “pump with higher NPSHr is better or with lower NPSHr particularly in case of higher head pumping

  26. click me says:

    fantastic intel you got here how anyone’s first impressions on mine post
    in respect to click me

  27. great intel we have at this time what you’re comments on mine web post relative to bowling king online hack

  28. Hey nice post. I hope it’s ok that I shared it on my Twitter, if not,
    no problem just let me know and I’ll remove it. Either way keep up the good work.

  29. Hi,I read your new stuff named “Why NPSHR Changes With Impeller Diameter? | Campbell Tip of the Month” on a regular basis.Your humoristic style is awesome, keep doing what you’re doing! And you can look our website about free anonymous proxies.

  30. It’s going to be end of mine day, except before finish I am reading this fantastic paragraph to increase my
    know-how.

  31. Tremendous things here. I’m very satisfied to look your post.
    Thanks a lot and I’m looking forward to contact you.
    Willl youu kindly drop me a mail?

  32. homepage says:

    Hello, I think your blog might be having browser compatibility issues.
    When I look at your blog in Opera, it looks fine but when opening in Internet Explorer, it has some overlapping.
    I just wanted to give you a quick heads up! Other then that, fanntastic blog!

What is the Impact of Water Content on the Dew Point and Hydrate Phase Behavior?

In a past Tip Of The Month (TOTM), we have shown that one of the first issues to be resolved by a facilities engineer working in a gas plant or gas production facility is where the process is operating with respect to the phase diagram.  A general knowledge, if not a detailed knowledge, will allow the design engineer and the facilities operator to make intelligent decisions that have significant impact on the profitability of a gas production facility.

The best way to prevent hydrate formation (and corrosion) is to keep the pipelines, tubing and equipment dry of liquid water. In this TOTM we will demonstrate how the water dew point and hydrate formation curves are shifted along a conventional phase envelope as natural gas is dehydrated.

Case Study:

In order to demonstrate the phase behavior of natural gases containing water and the impact of water content on the water dew point and hydrate formation temperatures, let’s consider the natural gas shown in Table 1. To generate the diagrams in this TOTM, we used ProMax [1] based on the Peng-Robinson equation of state (PR EOS) [2].

Table 1. Dry gas composition

Component Mole %
C1 80.0
C2 10.0
C3 4.0
iC4 3.0
nC4 3.0
Sum 100.0

Results and Discussion:

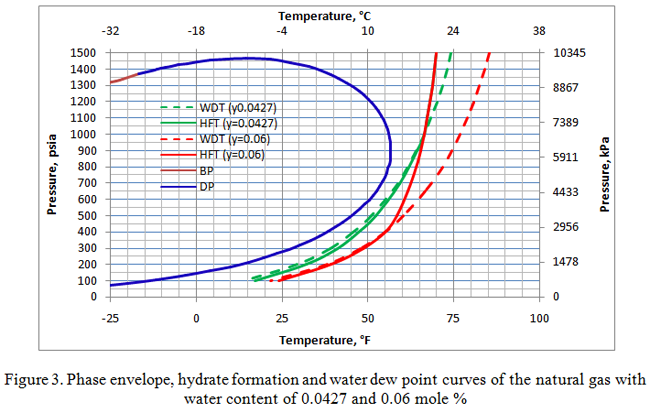
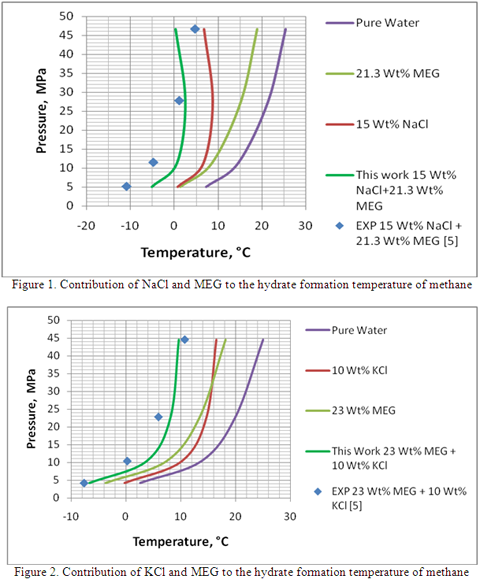
Figure 1 presents the phase envelope, hydrate formation and water dew point curves of this gas with a water content of 0.06 mole percent, equivalent to 28.5 lbm/MMSCF (456 kg/106 Sm3). Notice that up to a pressure of about 414 psia (2854 kPa), the water dew point curve is slightly to the left of the hydrate formation curve. This indicates that the gas is under-saturated with water at pressures below this point. This also means that it is thermodynamically unstable and will not form a free aqueous phase. All the water is converted to hydrate and this state is referred to as “meta-stable” equilibrium. For more detail on this meta-stable state, see December 2010 TOTM. Similar behavior is demonstrated in Figure 2 for which the water content was reduced to 0.0427 mole percent, equivalent to 20.3 lbm/MMSCF (324.6 kg/106 Sm3). In this case the water dew point and hydrate formation curves intersect at a higher pressure of 1000 psia (6895 kPa). Below this pressure, the gas is under-saturated and has a meta-stable equilibrium state. Therefore, the water dew point curve is to the left of the hydrate formation curve, but above the intersection pressure it moves to the right of the hydrate formation curve where the water content is above saturation.

Figure 1

Figure 3 presents the superimposition of Figures 1 and 2 having water dew point and hydrate formation curves for two different water contents (0.06 and 0.0427 mole%). Notice the hydrate formation curves for both cases coincide with each other for pressures of 1000 psia (6895 kPa) and higher.

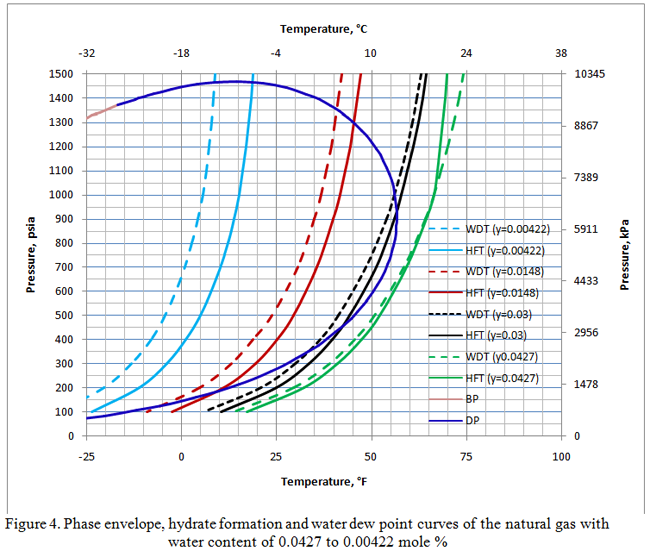
Figure 4 presents the phase envelope along with the water dew point and hydrate formation curves for the same gas as the water content was reduced to 0.0427, 0.03, 0.0148, and 0.00422 mole % corresponding to 20.3, 14.2, 7, 2 lbm/MMSCF (324.6, 228, 112, 32 kg/106 Sm3), respectively. Notice for all the cases where the gas is under-saturated with water, the water dew point curves are located to the left of the corresponding hydrate formation curves. Under these conditions the equilibrium state is thermodynamically unstable (meta-stable) and will not form a free aqueous phase. However, if the water content is above saturation point, then the water dew point will position to the right of the corresponding hydrate formation curve and free water will form under stable condition.

Figure 2Figure 3

Conclusions:

We have demonstrated the impact of the water content on the phase behavior of a natural gas. The emphasis was placed on the interaction of the water dew point and hydrate formation curves. It was shown that the relative location of the water dew point and hydrate curves with respect to each other is a strong function of the water content. It was also shown for the cases where water content is above saturation point, the water dew point curve locates to the right of the hydrate curve. Under this condition free water forms and then hydrates may form if conditions are right. This is what is normally expected and shown in text books. However, if the water content is under-saturated, the water dew point curve will be located to the left of the hydrate formation curve and the equilibrium state is thermodynamically unstable (meta-stable) and will not form a free aqueous phase.

As discussed in last month’s TOTM, facility engineers have to determine how this behavior affects their operations.  These phase envelopes suggest that, at low water concentrations, hydrates may form even though free water is not present.  Indeed, this phenomenon has been observed.  At cryogenic conditions, when the water is removed by molecular sieves, the amount of metastable water is so small it should not cause operational issues.

To learn more about similar cases and how to minimize operational problems, we suggest attending the John M. Campbell courses; G4 (Gas Conditioning and Processing) and G5 (Gas Conditioning and Processing-Special).

John M. Campbell Consulting (JMCC) offers consulting expertise on this subject and many others. For more information about the services JMCC provides, visit our website at www.jmcampbellconsulting.com, or email your consulting needs to consulting@jmcampbell.com.

By: Dr. Mahmood Moshfeghian

Reference:

  1. ProMax 3.2, Bryan Research and Engineering, Inc, Bryan, Texas, 2010.
  2. Peng, D. Y. and Robinson, D. B., I. and E. C. Fund, Vol. 15, p. 59, 1976.

Figure 4

12 responses to “What is the Impact of Water Content on the Dew Point and Hydrate Phase Behavior?”

  1. Essed says:

    i have problem to make code to estimate dew point pressure ,temperature and bubble point temperature using cubic equation of state
    but in bubble point pressure the code run and return good resuls
    pleas anyone help me

  2. Karma says:

    Thank you a loot for sharing this with all of us you really realize what
    you’re speaking about! Bookmarked. Kindly also consult with my site =).
    We maay have a hyperlink alternate contract among us

  3. Hi, i think that i saw you visited my weblog so i got
    here to go back the choose?.I am trying to in finding issues
    to enhance my site!I assume its good enough to use a few of your ideas!!

  4. Jan B Info says:

    hi!,I love your writing very soo much! share we commmunicate more approximately your post
    on AOL? I require a specialist on thks space to unravel my problem.
    Maybe that’s you! Having a look ahead to see you.

  5. There is no more.

  6. Rhona Linz says:

    Hi I am so glad I found your website, I really found you by error, while I was looking on Askjeeve for something else, Regardless I am here now and would just like to say thanks a lot for a marvelous post and a all round thrilling blog (I also love the theme/design), I don’t have time to browse it all at the minute but I have book-marked it and also included your RSS feeds, so when I have time I will be back to read a lot more, Please do keep up the superb work.

  7. Seonwook Kim says:

    Thanks for sharing your valuable knowledge.
    I was wondering if you could answer me the question that I have, which is

    “When the gas without free water is transforted through the gas export pipeline, could the water in the gas phase drops out and remains in the pipeline?”

    Regards,

  8. Tony V says:

    Thanks for sharing. I have another perspective that perhaps you can help guide. As a seller, would I prefer to sell my gas at 2lb/mmscf or 6lb/mmscf? Would gas at higher water content weight more? Is it acceptable to operate the plant at 6lb/mmscf from financial point of view?

  9. Steve Moseley says:

    Please send me this information to my email account , thanks,
    Steve Moseley
    Maintenance coordinator
    Pecos bend gas plant
    Pecos Texas 77982

  10. worawith says:

    If pipeline natural gas has P1 = 1050 psi , T1 = 80 degree F and water content = 6.8 lbs/mmscf , How much water content when dropped it to P2 = 200 psi and T2 = 36 degree F

    Thanks and Regards
    Worawith S

  11. Carlos Maldonado says:

    I want to receive posts by email.

  12. Rasoul Nasiri says:

    It seems Thermodynamics models are unable to accurately predict the formation dynamic of hydrates. Additionally, kinetics of nano- to micro-droplet growth might control the early stages of this complex process.

Should the TEG Dehydration Unit Design Be Based on the Water Dew Point or Hydrate Formation Temperature?

Glycol dehydration is the most common dehydration process used to meet pipeline sales specifications and field requirements (gas lift, fuel, etc.). Triethylene glycol (TEG) is the most common glycol used in absorption systems. Chapter 18, Gas Conditioning and Processing [1] presents the process flow diagram and basics of glycol units. A key parameter in sizing the TEG dehydration unit is the water dew point temperature of dry gas leaving the contactor tower. Once the dry gas water dew point temperature and contactor pressure are specified, water content charts similar to Figure 1 in reference [2] can be used to estimate the water content of lean sweet dry gas. The required lean TEG concentration is thermodynamically related to the dry gas water content which influences the operating (OPEX) and capital (CAPEX) costs. The lower dry gas water content requires a higher lean TEG concentration. This parameter sets the lean TEG concentration entering the top of contactor and the required number of trays (or height of packing) in the contactor tower.

The rich TEG solution is normally regenerated at low pressure and high temperature. Maximum concentrations achievable in an atmospheric regenerator operating at a decomposition temperature of 404 °F (206°C) is 98.7 weight %. The corresponding dry gas water dew point temperature for this lean TEG weight % and contactor temperature of 100°F (38°C) is 18°F  (-8°C).

If the lean glycol concentration required at the absorber to meet the dew point specification is higher than the above maximum concentrations, then some method of further increasing the glycol concentration at the regenerator must be incorporated in the unit. Virtually all of these methods involve lowering the partial pressure of the glycol solution either by pulling a vacuum on the regenerator or by introducing stripping gas into the regenerator.

For water saturated gases, the water dew point temperature is either above or at the hydrate formation temperature. However, if the gas is water under-saturated, the hydrate formation temperature will be higher than water dew point. This means at a given specified water dew point temperature, there are two water content values; the lower value will be at the hydrate formation temperature and the higher value will be at the water dew point temperature. Therefore, the designer has to choose one of these two values. Which value should be chosen? The answer to this question is “It depends”! The lower value of water content means higher lean TEG concentration and consequently higher CAPEX and OPEX.

In this TOTM we will attempt to answer the question by studying a case in which the specified water dew point temperature is below the hydrate formation temperature. For this purpose, we will discuss the water content of natural gas in equilibrium with hydrate and when the condensed water phase is liquid.

The water content chart of Figure 6.1 in reference [2] is based on the assumption that the condensed water phase is a liquid. However, at temperatures below the hydrate temperature of the gas, the “condensed” phase will be a solid (hydrate). The water content of a gas in equilibrium with a hydrate will be lower than equilibrium with a metastable liquid.

Hydrate formation is a time dependent process. The rate at which hydrate crystals form depends upon several factors including gas composition, presence of crystal nucleation sites in the liquid phase, degree of agitation, etc. During this transient “hydrate formation period” the liquid water present is termed “metastable liquid.” Metastable water is liquid water which, at equilibrium, will exist as a hydrate.

Reference [3] presents experimental data showing equilibrium water contents of gases above hydrates. Data from Reference [3] are presented in Figure 6.5 of reference [2] and plotted here as rotated square in Figure 1 at 1000 Psia (6,897 kPa). For comparative purposes, the “metastable” water content of the gas (dashed line) as well as the hydrate formation temperature (solid line) calculated by ProMax [4] using the Peng-Robinson [5] equation of state are also shown. The water content of gases in the hydrate region is a strong function of composition. Figure 1 should not be applied to other gas compositions.

Figure 1

Figure 1. Water content of 94.69 mole % methane and 5.31 mole % propane – gas in equilibrium with hydrate at 1000 Psia (6,897 kPa)

Case Study:

To demonstrate, the effect of water content of a dried gas in equilibrium with hydrate on the required lean TEG concentration, let’s consider the gas mixture presented in Figure 1. This gas enters a contactor tower at 1000 Psia (6,897 kPa) and 100 °F (37.8°C) with a rate of 144 MMSCFD (4.077 106 Sm3/d). At this condition, the water content of the wet gas is 57.6 lb/MMSCF (922.4 kg/106 Sm3). It is desired to dehydrate the gas to a water dew point temperature of 5°F (-15°C) using a TEG dehydration unit.

Results and Discussion:

According to Figure 1, at a temperature of 5°F (-15°C) the water content is 1.2 lb/MMSCF (19.2 kg/106 Sm3) and 1.97 lb/MMSCF (31.5 kg/106 Sm3) in equilibrium with metastable water and hydrate phase, respectively. ProMax was used to simulate this TEG dehydration unit for the case of three theoretical trays in the contactor tower.  The simulation results for these two water content cases are shown in Table 1. This table clearly indicates that the required lean TEG concentrations are not the same and consequently will impact the regeneration requirements of the rich TEG solution. The difference between the lean TEG concentrations will be even more at a lower dry gas water dew point specification.

The simulation results clearly indicate that the choice of water content for a specified dry gas water dew point as the basis for design affects the required lean TEG concentration and consequently the rich TEG solution regeneration requirements.

Table 1. Comparison of simulation results for two different water content specifications

Simulation Results Using ProMax Based on Water Dew Point Temperature of 5 °F (-15°C) Based on Hydrate Formation Temperature of 5 °F (-15°C)
Water Dew Point Temperature , °F (°C) 5.0 (-15.0) -6.2 (-21.2)
Hydrate Formation Temperature, °F (°C) 14.7 (-9.6) 5.0 (-15.0)
Water Content, lb/MMSCF (kg/106 Sm3) 1.97 (31.5) 1.20 (19.2)
Gallon/lb of Water Removed (liter/kg of Water Removed) 3.95 (32.9) 3.90 (32.4)
Lean TEG Weight % 99.45 99.72

Conclusions:

When designing dehydration systems, particularly TEG systems to meet extremely low water dew point specifications, it is necessary to determine the water content of the dried gas in equilibrium with a hydrate using a correlation like that presented in Figure 1. If a metastable correlation is used, one will overestimate the saturated water content of the gas at the dew point specification. This, in turn, may result in a dehydration design which is unable to meet the required water removal. Where experimental data is unavailable, utilization of an EOS-based correlation which has been tuned to empirical data can provide an estimate of water content in equilibrium with hydrates.

To meet pipeline sales specifications, it is normally acceptable to use the water content in equilibrium with the metastable phase (the dashed line in Figure 1) because the difference in the water contents is not that high. However, for extremely low water dew point specifications where there is a cryogenic process downstream, it is recommended to use the water content in equilibrium with hydrate (the solid line in Figure 1).

To learn more about similar cases and how to minimize operational problems, we suggest attending the John M. Campbell courses: G4 (Gas Conditioning and Processing) and G5 (Gas Conditioning and Processing-Special).

John M. Campbell Consulting (JMCC) offers consulting expertise on this subject and many others. For more information about the services JMCC provides, visit our website at www.jmcampbellconsulting.com, or email your consulting needs to consulting@jmcampbell.com.

By: Dr. Mahmood Moshfeghian

Reference:

  1. Campbell, J. M., “Gas Conditioning and Processing”, Vol. 2, The Equipment Module, 8th Ed., Second Printing, J. M. Campbell and Company, Norman, Oklahoma, 2002
  2. Campbell, J. M., “Gas Conditioning and Processing”, Vol. 1, The Basic Principles, 8th Ed., Second Printing, J. M. Campbell and Company, Norman, Oklahoma, 2002
  3. Song, K.Y. and Kobayashi, R, “Measurement & Interpretation of the Water Content of a Methane-5.31 Mol% Propane Mixture in the Gaseous State in Equilibrium With Hydrate,” Research Report RR-50, Gas Processors Association, Tula, Oklahoma, 1982
  4. ProMax 3.1, Bryan Research and Engineering, Inc, Bryan, Texas, 2010.
  5. Peng, D. Y. and Robinson, D. B., I. and E. C. Fund, Vol. 15, p. 59, 1976.

1 response to “Should the TEG Dehydration Unit Design Be Based on the Water Dew Point or Hydrate Formation Temperature?”

  1. Ahmed Gamaleldin says:

    please correct me if i’m wrong, you mentioned that “According to Figure 1, at a temperature of 5°F (-15°C) the water content is 1.2 lb/MMSCF (19.2 kg/106 Sm3) and 1.97 lb/MMSCF (31.5 kg/106 Sm3) in equilibrium with metastable water and hydrate phase, respectively.”.it seems that 1.97 lb/MMSCF should be for metastable and 1.2 lb/MMSCF for hydrate, in contrast to aforementioned.

Process Analysis of Hydrogen Blistering in NGL Fractionation Unit

Hydrogen blistering is a type of hydrogen-induced failure produced when hydrogen atoms enter low-strength steels that have macroscopic defects, such as laminations. The defects in the steel (void spaces) provide places for hydrogen atoms to combine, forming gaseous molecular hydrogen (H2) that can build enough pressure to produce blistering. Hydrogen blistering is a problem mainly in sour environments. It does not cause a brittle failure, but it can produce rupture or leakage [1]. Description and mechanisms of hydrogen blistering can be found in literature [2]. Hydrogen sulfide concentration, temperature and thickness of material affect hydrogen blistering.

In this TOTM we will consider the quantitative effect of temperature and hydrogen sulfide mole fraction causing hydrogen damage in the fractionation columns of an operating natural gas liquid (NGL) Plant [3]. The fractionation unit was designed to process a broad-cut of NGL, which is an off-product from crude oil production units and produces essentially propane, butane, and natural gasoline. The feed to the process is introduced into the fractionation unit where propane, butane and gasoline are separated by three distillation columns. In the first column, which is a deethanizer, ethane and lighter compounds are separated from the feed stream. In the second column, a depropanizer, propane is fractionated and sent to the amine treater for further processing to meet market specifications. The bottoms of the depropanizer are fed to the third column, a debutanizer, in which butane is distilled over and sent to a Merox unit for further treating. The bottoms of the debutanizer column, essentially gasoline, are also sent to Merox for treating. More information on NGL production technologies can be found in reference [4].

During the overhaul of this NGL Plant, the inspection team found that the deethanizer-reflux-accumulator had been damaged due to severe hydrogen blistering in the shell and bottom plate, and the vessel was rejected. Four years later, during an inspection of the Plant, the deethanizer rectifying section and depropanizer rectifying section were found to have been severely damaged by hydrogen blistering.

In order to study the effects of hydrogen sulfide and local temperature quantitatively and more closely, the three distillation columns in a fractionation unit were simulated. In this simulation, which could assist one to thoroughly understand the causes of hydrogen attack, the values of temperature and hydrogen sulfide mole fraction along each column were determined by performing tray-by-tray calculations.


Case Study:

The operating NGL Plant consists of fractionation, treating, drying, refrigeration, utility, storage and loading facilities to process approximately 57,700 barrels (9172 m3) of broad-cut NGL per day. The charge to this plant is essentially Natural Gasoline Liquid which is condensed out of oil-field gas and off-product from several crude oil production units. The broad-cut is processed to produce propane, butane and light gasoline (Pentane Plus Product). The feed stream also contains some impurities such as hydrogen sulfide, carbon dioxide and mercaptan, which are removed by treating the products after fractionation.

Since hydrogen blistering occurred only in the fractionation unit, a brief description of this unit is given in the following section [3].

A schematic flow diagram for this unit is given in Figure 1. The 40-tray deethanizer tower receives raw feed from NGL recovery plants, fractionates out ethane and lighter products and delivers essentially ethane-free NGL to the depropanizer column. The feed to the deethanizer is introduced between the 27th and 28th trays at 135°F and 362 Psig (57.2 °C and 2497 kPag). Bottoms product from the deethanizer is charged to tray 22 of a 45-tray depropanizer column. The distillate product, which is essentially propane, is sent to the amine treater unit for further processing. The depropanizer bottoms are charged to tray 20 of the 40-tray debutanizer column. The debutanizer distillate product, which comprises the net butane product, is sent to the Merox plant for treating. The debutanizer bottom (pentane and heavier products essentially free of butane) is also sent to the Merox plant for further processing.

Figure 1

Figure 1. Flow diagram of fractionation unit


The following information was specified for simulation of the fractionation unit:

(i)   Flow diagram as shown in Figure 1

(ii)  Feed stream condition and composition as shown in Table 1

(iii) Column specification as presented in Table 2

Other specifications such as a desired percentage recovery of a component in any product stream, could have been used instead of the reflux ratio or bottoms product  ratio. In the course of simulation, tray by tray calculations were performed to calculate temperature, pressure, vapor and liquid compositions, and vapor and liquid traffics for each tray in each column. In addition, distillate and bottoms rates, temperature, pressure, composition, reboiler and condenser duties were also calculated, as were height and diameter of the columns.

To perform the simulation, Vapor Liquid Equilibrium K-values, liquid and vapor enthalpies were computed by the Peng-Robinson equation of state [5].  In the tray-by-tray calculation it was assumed that the trays performed ideally (100 % efficiency). The simulation was carried out by UniSim simulation software [6]


Table 1. Feed stream composition and specification

Component Mole %
CO2 1.167
H2S 0.325
Methane 5.625
Ethane 15.724
Propane 28.190
i-Butane 6.724
n-Butane 17.812
i-Pentane 5.812
n-Pentane 6.846
n-Hexane 5.998
C7+ 5.777
T, °F (°C) 135.0 (57.2)
P, Psig (kPag) 362.0 (2497)
Rate, lbmole/hr (kmole/h) 8619 (3909)


Table 2. Fractionation towers specifications

Column Pressure, Psig (kPag) No of Trays Feed Tray from Bottom Reflux Ratio, L/F Bottoms Ratio, B/F Condenser Type
Feed Condenser Reboiler
Deethanizer 362 (2497) 347(2393) 360 (2483) 40 27 0.4438 0.7749 Partial
Depropnizer 300(2069) 290(2000) 300 (2069) 45 22 1.0709 0.6415 Total
Debutanizer 95 (655) 85(586) 95 (655) 40 20 1.0082 0.4889 Total

Results and Discussion:

Performing a simulation, a great deal of information is produced. However, only information of interest in regard to hydrogen blistering is presented here. To test the validity of the simulation results, composition and condition of the key process streams are compared with those supplied by the designer of the plant [7] and presented in Table 3. In most cases the results compare favorably. In addition, condenser and reboiler duties for each column are compared with the original design values in Table 4. This comparison of the two sets of results shows a maximum deviation of –13.3% for the depropanizer reboiler. With the exception of the deethanizer boiler, all of the design heat exchange duties are higher than those obtained in this simulation, which is, of course, a normal safeguard in plant design.

Table 3 shows hydrogen sulfide is fractionated in the first two columns and does not reach the debutanizer column. Since hydrogen blistering occurred in the first two columns, only these results were examined closely. To study the variation of hydrogen sulfide composition (in both liquid and vapor phases) along each column, its composition is plotted as a function of tray number. This is shown in Figure 2 for the deethanizer and Figure 3 for the depropanizer.


Table 3. Comparison of simulation results and design data for process streams leaving fractionation towers

Component Stream 5 Stream 13 Stream 21 Stream 25
Simulation Design Simulation Design Simulation Design Simulation Design
CO2 5.183 5.184 0.000 0.000 0.000 0.000 0.000 0.000
H2S 1.213 1.149 0.185 0.208 0.000 0.000 0.000 0.000
Methane 24.983 24.991 0.000 0.000 0.000 0.000 0.000 0.000
Ethane 65.138 66.171 3.812 2.994 0.000 0.000 0.000 0.000
Propane 3.483 2.505 92.460 95.808 6.779 3.987 0.000 0.000
i-Butane 0.000 0.000 3.244 0.890 22.918 25.484 0.002 0.011
n-Butane 0.000 0.000 0.298 0.100 69.276 69.542 0.529 0.477
i-Pentane 0.000 0.000 0.000 0.000 0.990 0.923 22.880 22.951
n-Pentane 0.000 0.000 0.000 0.000 0.037 0.064 28.133 28.105
n-Hexane 0.000 0.000 0.000 0.000 0.000 0.000 24.682 24.682
C7+ 0.000 0.000 0.000 0.000 0.000 0.000 23.773 23.774
Total 100.0 100.0 100.0 100.0 100.0 100.0 100.0 100.0
T, F 16.4 20.0 134.5 141.0 131.2 144.0 264.6 273.0
T, C -8.7 -6.7 56.9 60.6 55.1 62.2 129.2 133.9
P, psig 347 290 85 95
P, kPa(g) 2393 2000 586 655
Rate, lbmole/hr 1940.4 1939.8 2394.1 2394.1 2189.6 2189.6 2094.5 2094.5
Rate, kmole/h 880.2 879.9 1086.0 1085.9 993.2 993.2 950.1 950.0


Similarly, in Figure 4, the temperature variation along these two columns is plotted as a function of tray number, and it can be seen that the temperature profiles decrease smoothly from bottom to top except in the feed zone, which is to be expected in a distillation column with no side draw or inter-stage reboiler/cooler.

Figure 2 and 3

Figure 2 indicates that the maximum mole fraction of hydrogen sulfide occurred on tray 11 in the stripping section of the deethanizer while hydrogen blistering occurred in the rectifying section. Therefore, other factors such as temperature must be influencing the hydrogen damage. In the stripping section where no hydrogen blistering occurred, the temperature was higher than in the rectifying section where hydrogen blistering was detected. Another region where hydrogen blistering was found is the top part of the depropanizer rectifying section. In this section of the column, the hydrogen sulfide mole fraction is almost the same as in the stripping section of the deethanizer; however the temperatures for these two sections are not the same. The temperature range for the deethanizer stripping section is 142° to 240°F (61.1 to 115.6°C), and for the troubled region of the depropanizer, it is 142° to 134° F (61.1 to 56.6°C), trays 44, 45 and the condenser. Again, it can be seen how temperature influences the hydrogen blistering damage process. In this case, the hydrogen blistering was occurring at lower temperatures. Simulation results also indicate that carbon dioxide does not reach the depropanizer and debutanizer.

Figure 4


Conclusions:

Based on the simulation results and preceding discussion, the following conclusions can be made:

1-   Hydrogen blistering can occur where hydrogen sulfide is present. In the case studied a mole fraction of as low as 0.002 for hydrogen sulfide caused hydrogen damage.

2-   With the presence of hydrogen sulfide, temperature is the important factor promoting hydrogen blistering. In the case studied a temperature of less than 142°F (61.1°C) caused hydrogen damage. Higher temperature drives hydrogen out of the wall to atmosphere.


There are probably other factors governing hydrogen damage such as microstructure of materials, thickness of material, presence of CO2, etc. Even though the simulation was performed based on a dry feed, the actual feed to the plant contained some water.

The above results are consistent and the same as those reported by the author in 1985 [3]. In the original work, the simulation was carried out by a computer package named Process Analysis System (PAS) developed by Erbar and Maddox [8]. At that time, the computations were made on an IBM 370 main frame at Shiraz University Computing Center. The Soave-Redlich-Kwong [9] equation of state was used in the original work.


A heat exchanger failure at the Tesoro Anacortes refinery was determined to have experienced a form of hydrogen blistering. That failure led to the deaths of seven workers and the refinery was shut down for over six months to repair the damage.  It was determined that the root cause of the failure was hydrogen blistering in the steel of the heat exchanger which resulted in rupture.  These types of hydrogen attacks can be discovered during scheduled inspections.  If there is a concern that conditions are conducive to hydrogen blistering, one can use a hydrogen patch probe to measure hydrogen activity within metals.  If hydrogen activity is found in the metal, then additional testing can be completed to determine if any internal cracks have developed.


To learn more about similar cases and how to minimize operational problems, we suggest attending the John M. Campbell courses; G4 (Gas Conditioning and Processing) and G5 (Gas Conditioning and Processing-Special).


John M. Campbell Consulting (JMCC) offers consulting expertise on this subject and many others. For more information about the services JMCC provides, visit our website at www.jmcampbellconsulting.com, or email your consulting needs to consulting@jmcampbell.com.


By: Dr. Mahmood Moshfeghian

Reference:

  1. http://www.glossary.oilfield.slb.com/Display.cfm?Term=hydrogen%20blistering
  2. Mostert, R., and Sharp, W.R., “Low Temperature Hydrogen Damage Assessment in the Gas and Refining Industries,” 3rd Middle East Nondestructive Testing Conference & Exhibition – Bahrain, Manama, 27-30 Nov 2005.
  3. Moshfeghian, M., “Hydrogen damage (Blistering) case study: Mahshahr NGL Plant”, Iranian J. of Science & Technology, Vol 11, No.1, 1985.
  4. Campbell, J. M., “Gas Conditioning and Processing”, Vol. 2, The Equipment Module, 8th Ed., Second Printing, J. M. Campbell and Company, Norman, Oklahoma, 2002
  5. Peng, D. Y. and Robinson, D. B., I. and E. C. Fund, Vol. 15, p. 59, 1976.
  6. UniSim Design R390.1, Honeywell International, Inc., Calgary, Canada, 2010.
  7. Parsons, R. M., NGL Fractionation Facilities, Operation Manual Bandar Mahshahr, The Ralph M. Parsons Company U. K. Ltd.
  8. Erbar, J. H., and Maddox, R. N., Process Analysis System, Documentation, Oklahoma State University, Stillwater OK., 1978.
  9. Soave, G., Chem. Eng. Sci. Vol. 27, No. 6, p. 1197, 1972.


3 responses to “Process Analysis of Hydrogen Blistering in NGL Fractionation Unit”

  1. This is my first time pay a visit at here and i am in fact impressed to
    read all at single place.

  2. Magnificent beat ! I would like to apprentice while you amend
    your web site, how could i subscribe for a blog web site? The account aided me a
    acceptable deal. I had been a little bit acquainted of
    this your broadcast offered bright clear concept

  3. Dr.ChemE says:

    A great read. Just some small things to make the article mistake free.
    1. I think the de-ethanizer column is Full Reflux and not Partial Reflux as specified in table 2.
    2. There is a reference of Table 4 in the article but I don’t see any table 4 here.

    Thank you.

Determination of Traces of Methanol in the TEG Dehydrated Gas

The best way to prevent hydrate formation (and corrosion) is to keep pipelines, tubing and equipment dry of liquid water. There are occasions, right or wrong, when the decision is made to operate a line or process containing liquid water. If this decision is made, and the process temperature is below the hydrate point, inhibition of this water is necessary. This is of particular interest in gas gathering systems [1] and subsea operations [2] during normal production as well as during shut down.

Many materials may be added to water to depress both the hydrate and freezing temperatures. For many practical reasons, a thermodynamic hydrate inhibitor (THI) such as an alcohol or one of the glycols is injected, usually methanol, diethylene glycol (DEG) or monoethylene glycol (MEG). All may be recovered and recirculated, but the economics of methanol recovery may not be favorable in many cases. Hydrate prevention with methanol and or glycols can be quite expensive because of the high effective dosage required (10% to 60% of the water phase). Large concentrations of solvents aggravate potential scale problems by lowering the solubility of scaling salts in water and precipitating most known scale inhibitors. The total injection rate of inhibitor required is the amount/concentration of inhibitor in the liquid water phase for the desired hydrate temperature suppression, plus the amount of inhibitor that will distribute in the vapor and liquid hydrocarbon phases. Any inhibitor in the vapor phase or liquid hydrocarbon phase has little effect on hydrate formation conditions.  Due to the accuracy limitations of the hydrate depression calculations and flow distribution in the process, it is recommended that the hydrate formation temperature with inhibition be chosen with a design factor below the coldest expected operating temperature of the system to ensure adequate inhibitor injection rates.

Solubility loss of MEG in the gas phase is negligible and loss to the liquid hydrocarbon phase is very low, 3.5 L/106Sm3 (0.23 lbm/MMscf) [3]. Methanol losses are more significant, particularly vapor phase losses.  Based on Figure 6.20 in reference [3], depending on operating conditions, the solubility loss of methanol into the gas phase can be very high, typically 16 mg/Sm3 (1 lbm/MMscf) for every percent methanol in water phase. Losses to the liquid hydrocarbon are higher than for MEG but usually less than 1-2 % of hydrocarbon volume. At typical pipeline inhibition conditions, a solubility of about 0.4 kg/m3 (0.15 lbm/bbl) is generally adequate for planning purposes [3]. Depending on solubility losses, chemical makeup requirements for methanol can be very large and expensive for both once-through systems and methanol recovery units. In addition, the downstream processes like petrochemical and LNG plants cannot tolerate methanol in the feed gas.

Determination of the amount and concentration of inhibitors and their distribution in different phases is very important for practical purposes and industrial applications. Therefore, to determine the required amount and concentration of these inhibitors, several thermodynamic models for hand and rigorous calculations have been developed and incorporated into computer software [4].

As previously stated, a significant amount of methanol would be lost to the hydrocarbon phases, which may cause problems for refineries, petrochemical, and gas plants downstream. In gas plants where there is propane recovery the methanol will follow the propane product and be a potential cause for propane to go off specification. Methanol has also been known to cause premature failure in molecular sieves. In refineries the methanol must be washed out of the crude/condensate, where it presents a problem in wastewater treatment. In petrochemical plants methanol is also considered poison for catalysts.

In offshore production, gas lift and gas injection for pressure maintenance are becoming common practice. The associated gas produced with crude oil and water is separated, compressed and normally dehydrated with triethylene glycol (TEG) before injection or export. Since the produced oil/water/gas lines pose hydrate formation during normal production or shut downs, methanol is commonly injected to prevent hydrate formation and plugging of flow lines and gas lift/reinjection lines. Occasionally, TEG dehydration units shut down or may produce off spec dry gas which requires methanol injection. Consequently, some of the injected methanol ends up back in the produced oil/water/gas stream.

In this TOTM we will consider the presence of methanol in the produced oil/water/gas stream and determine the quantitative traces of methanol ending up in the TEG dehydrated gas. To achieve this, we simulated by computer an offshore production facility consisting of oil/water/gas multistage-separation, compression and TEG dehydration processes and determined the methanol concentration in the dried gas. We also studied the effect of wet gas temperature, the number of theoretical trays in the TEG contactor, the water content spec of dry gas, and lean TEG circulation rate on the dried gas methanol content. For this purpose methanol content in the production stream was assumed to vary from zero to 350 PPM (V).

Case Study:

A simplified process flow diagram (PFD) for the offshore production facilities considered in this study is shown in Figure 1. The production stream (oil, water, gas, and methanol) was passed through the high pressure separator where free water and gas were separated and the oil was passed through the intermediate and low pressure separators for subsequent gas separation from oil. The separators’ off gas streams were recompressed and cooled to 48 bara and 35 °C (696 psia and 95 °F) before entering the TEG contactor for dehydration. The dried gas was compressed further (not shown in the PFD) to 232 bara (3365 psia) for reinjection or export purposes. To meet a water content spec of 32 mg/Sm3 (2 lbm/MMscf) or lower, a lean TEG concentration of 99.95 weight percent was used in all of the simulation runs.

To study the impact of methanol (MeOH) concentration and determine its traces in the TEG dehydrated gas, the MeOH content of the production stream feed to the high pressure separator was assumed to vary from 0 to 350 PPM (V). This variation of MeOH content was chosen due to the uncertainty of its concentration in the production stream. The wet compressed gas temperature is an important parameter in the operation of a TEG unit and affects the water content of dried gas and the required lean TEG solution circulation rate and/or the number of required theoretical trays. Depending on the design and/or operational problem like scaling on the cooling side of the gas cooler, the wet gas temperature may be higher than 35 °C (95 °F). Therefore, the wet gas temperature was assumed to vary from 35 to 50 °C with 5 °C increment (95 to 122 °F and 9 °F increment). Depending on the requirement, 2 or 3 trays theoretical was used in the contactor unit. For each case the lean TEG solution rate was varied to meet the desired water content specification for each case.

Figure 1

Figure 1. Simple process flow diagram used in this case study

Results and Discussion:

The ProMax simulation software [6] was used to perform computer simulations for different cases of interest and determined the concentration/traces of MeOH in the TEG dehydrated gas. Twelve cases were studied in which the number of theoretical trays, wet feed gas temperature and pressure, dried gas water content, lean TEG solution weight percent, circulation rate, pressure and temperature were specified. For each case the MeOH content in the feed to the high pressure (HP) separator was assumed to vary from 0 to 350 part per million by volume, PPM (V) and the corresponding MeOH concentration in dried gas was determined. Table 1 presents the computer simulation results for one the 12 case studies. The absorption % presented in the last two columns of Table 1 is defined as:

Overall % = 100 (MeOH PPM in feed to the HP Separator – MeOH PPM in dry gas) /( MeOH PPM in feed to HP Separator)

TEG Contactor % = 100 (MeOH PPM in wet gas – MeOH PPM in dry gas) /( MeOH PPM in wet gas).

Notice the calculated MeOH absorption percents are relatively constant and independent of MeOH PPM in the feed to HP separator or wet gas. As shown in the last row of Table 1, the process overall and TEG contactor MeOH absorption percents are 61.1, and 30.6, respectively.

Table 1. Typical computer simulation results

Lean TEG Wt%=99.95 Lean TEG Solution Std Liquid Vol Rate = 2.91 m3/h (16.9 L TEG/kg Water)
No. of Theoretical Tray=3 Lean TEG Solution Temperature = 38 °C
Wet Gas To TEG      T, °C MeOH, PPM (V) Dry Gas MeOH Absorption
In the Feed of Inlet HP Separator In Wet Gas To TEG In TEG Dry Gas Hydrate Formation T, °C Water Content lbm/MMSCF Water Content mg/Sm3 TEG Contactor % Overall %
35 0 0 0.0 -20.0 1.00 16.0 NA NA
25.6 14.4 10.0 -20.0 1.00 16.0 30.6 60.9
70.0 39.4 27.4 -20.0 1.00 15.9 30.5 60.8
104.9 59.0 41.0 -20.0 0.99 15.9 30.5 60.9
139.8 78.5 54.5 -20.0 0.99 15.9 30.6 61.0
174.6 97.9 68.0 -20.1 0.99 15.8 30.5 61.1
209.4 117.0 81.4 -20.1 0.99 15.8 30.4 61.1
244.2 137.0 94.8 -20.1 0.98 15.8 30.8 61.2
278.9 156.0 108.0 -20.1 0.98 15.7 30.8 61.3
313.6 175.0 121.0 -20.1 0.98 15.7 30.9 61.4
348.3 194.0 134.0 -20.2 0.98 15.7 30.9 61.5
Average 30.6 61.1

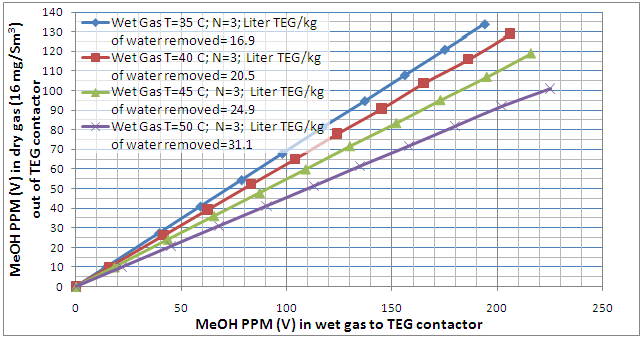
The MeOH concentration profile in the dried gas as a function of MeOH concentration in the feed to HP separator and MeOH concentration in the wet gas for 4 of these cases are presented in Figures 2 and 3, respectively.  Notice the number of theoretical trays (N=3) and dried gas water content spec (16 mg/Sm3) were kept constant in these two figures. These two figures indicate that as the wet gas temperature increases, the lean TEG solution increases; therefore, more MeOH is picked up (absorbed) by TEG solution. This is explained by the fact that as the wet gas temperature increases, its capacity to hold water vapor increases. Since the dry gas water content spec had to remain constant, more lean TEG solution is required to remove the water. Because of higher lean TEG circulation rate, more MeOH is also absorbed in the contactor.

Table 2 presents the summary results for all 12 cases investigated. As shown in this table, for dry gas water content spec of 16 mg/Sm3 (1 lbm/MMscf), in comparison to three theoretical trays, the case of two theoretical trays requires a higher circulation rate; therefore, the MeOH absorption factor increases drastically (lower traces of MeOH in dry gas). The MeOH absorption is a function of the TEG circulation rate through the contactor.  The greater the circulation rate, the greater the absorption.  This high MeOH absorption % is favorable for the downstream process units; however, for the cases of N=2 and wet gas temperatures of 45 and 50 °C, the required liter of TEG per kg of water removed is much higher than the recommended value. According to Chapter 18 of reference [5], the recommended range is from 16 to 50 liter of TEG per kg of water removed (2 to 6 gal TEG/lb water removed). For dry gas water content spec of 32 mg/Sm3(32 lbm/MMscf) and two theoretical trays, the required lean TEG circulation rate drops down within the recommended range for all four wet gas temperatures.

Figure 2

Figure 2. Variation of MeOH content of the TEG dehydrated gas as a function of MeOH content in the inlet separatoor feed and wet gas temperature

Figure 3

Figure 3. Variation of MeOH content of the TEG dehydrated gas as a function of the wet gas MeOH content temperature

Table 2. Summary of all simulation results

Table 2

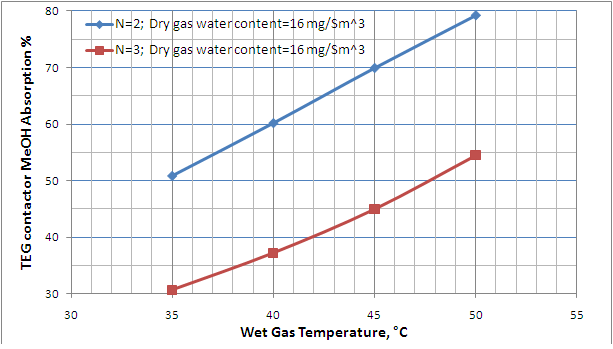
The results in Table 2 are also represented in Figures 4 and 5. These figures can be used to estimate quickly the MeOH content of TEG dehydrated gas for a specified number of theoretical trays, and the wet gas temperature and MeOH content.

In summary, a case study based on an offshore production facility was undertaken to investigate the impact of design and operational parameters on the trace of MeOH in the TEG dehydrated gas. The results can be summarized as follows:

  1. The MeOH concentration in TEG dehydrated gas is proportional to the MeOH concentration in the feed to HP separator or in the wet gas to the TEG contactor.
  2. The MeOH concentration in TEG dehydrated gas decreases as the wet gas temperature increases.
  3. The MeOH concentration in TEG dehydrated gas decreases as the theoretical number of trays decreases, (or as the TEG circulation rate increases).

Notice, the above results were drawn based on twelve simulation runs for a single case study. They may be used for general guidelines. We believe each specific case should be analyzed separately and thoroughly.

To learn more about similar cases and how to minimize operational problems, we suggest attending the John M. Campbell courses; G4 (Gas Conditioning and Processing) and G5 (Gas Conditioning and Processing-Special).

John M. Campbell Consulting (JMCC) offers consulting expertise on this subject and many others. For more information about the services JMCC provides, visit our website at www.jmcampbellconsulting.com, or email your consulting needs to consulting@jmcampbell.com.

By: Dr. Mahmood Moshfeghian

Reference:

  1. Bullin, K.A., Bullin, J.A., “Optimizing methanol usage for hydrate inhibition in a gas gathering system,” Presented at the 83rd Annual GPA Convention – March 15, 2004.
  2. Szymczak, S., Sanders, K., Pakulski, M., Higgins, T.; “Chemical Compromise: A Thermodynamic and Low-Dose Hydrate-Inhibitor Solution for Hydrate Control in the Gulf of Mexico,” SPE Projects, Facilities & Construction, (Dec 2006).
  3. Campbell, J. M., “Gas Conditioning and Processing”, Vol. 1, The Basic Principles, 8th Ed., Second Printing, J. M. Campbell and Company, Norman, Oklahoma, (2002).
  4. Asadi Zeydabadi, B., Haghshenas, M., Roshani, S., and Moshfeghian, M., “Prevent system hydrate formation during sudden depressurization,” Hydrocarbon Processing, J., pp 83-91, April 2006.
  5. Campbell, J. M., “Gas Conditioning and Processing”, Vol. 2, The Equipment Module, 8th Ed., Second Printing, J. M. Campbell and Company, Norman, Oklahoma, (2002).
  6. ProMax 3.1, Bryan Research and Engineering, Inc, Bryan, Texas, 2009.

Figure 4

Figure 4. Effect of wet gas temperature and number of theoretical trays absorption %  on the TEG contactor MeOH absorption %

Figure 5

Figure 5. Effect of wet gas temperature and dry gas water content spec on the TEG contactor MeOH absorption %

4 responses to “Determination of Traces of Methanol in the TEG Dehydrated Gas”

  1. Vasile says:

    Dear Sir,
    Very interesting your papers regarding gas processing. We are working on a TEG dehydration unit for NG and CO2 and I would like to ask you if the presence of traces of methanol could have a negative influence on the TEG drying and regeneration process and if so which could be the limiting methanol concentration. Thank you very much.

  2. Tory Cofresi says:

    Hey there! I’ve been following your web site for a long time now and finally got the bravery to go ahead and give you a shout out from Houston Texas! Just wanted to tell you keep up the fantastic work!

  3. A lot of the things you say happens to be astonishingly precise and that makes me ponder the reason why I had not looked at this with this light previously. Your article truly did turn the light on for me personally as far as this specific subject goes. However at this time there is actually 1 factor I am not really too comfortable with so while I attempt to reconcile that with the central theme of your position, permit me see what the rest of the subscribers have to point out.Well done.

  4. […] October 2010 tip of the month (TOTM) considered the presence of methanol in the produced oil/water/gas stream and determined the […]

  5. […] M., October 2010 tip of the month, PetroSkills – John M. Campbell, […]

  6. KOKOSSAI JEAN says:

    Hello Sir, I am in Cameroon, I am in internship in GAZ DU CAMEROUN and I am working on Hydrate formation, Gaz du Cameroun have a problem of hydrates formation; it injected methanol but the results in not concluant, Sir I want to know how make to prevent this hydrate. It is condensat gas reservoir.

Important Aspects of Centrifugal Compressor Testing – Part 2

This is the final part of a two part Tip of the Month (TOTM) series on important aspects related to centrifugal compressor performance testing.  The first part dealt with the review of the testing procedure presented in ASME PTC-10 (also referred to as the Code), selection criteria for test gases and factors to consider in a performance testing.  This TOTM will review the basic assumptions and performance relationships required for an accurate test.  Also discussed are three important principles: volume ratio, Machine Mach Number and Machine Reynolds Number, which also influence the accuracy of the test results.

Introduction
The Code recognizes that the actual testing conditions and the specified design conditions may not be identical.  Basic assumptions are made so that test results can be compared to the original design or some other baseline datum.  For example, a compressor can have a different efficiency depending on where it is operating on a head-flow curve.  However, if the gas composition and operating condition are not the same as the original design, then how accurate are the results?  This question will be discussed below.

There are other important parameters utilized by the Code to analyze compressor performance.  The first two are called flow coefficient and work coefficient.  These are dimensionless parameters that are useful in the interpretation of test results, especially when comparing the test results to the original design or some other datum.  Three more important parameters are called volume ratio, Machine Mach Number, and Machine Reynolds Number. These parameters assure that the aerodynamic properties of a compressor are maintained whenever test gases or alternate operating conditions are used.  In addition, they establish limits on the operating range and help correct head and efficiency for friction losses.   Each parameter will be briefly discussed.

Dimensionless Parameters
Most likely the actual testing conditions and specified design conditions are not identical.  To compensate for the differences, the Code utilizes dimensionless parameters called flow coefficient, work coefficient and total work coefficient.   The Code also makes assumptions regarding each coefficient and their equivalency at test and specified conditions.  Table 1 lists the Code’s principle parameters and the assumptions used to convert test data into values at specified design conditions.

Changes in compressor performance can be determined whenever the speed fluctuates by simply utilizing the affinity laws.  If the compressor flow, head and efficiency characteristics are known at a given speed, then merely applying the affinity laws at an alternate speed will produce a new curve representing the compressor performance at that speed.   This is the same concept behind head and flow coefficients.  In essence, the flow coefficient represents the “normalized flow rate” of the compressor at any speed.  Similarly, the work coefficient and total work coefficient represents the “normalized head” of the compressor at any speed.  The affinity laws also imply that the efficiency represented at the two equivalent conditions will remain the same.  These properties play a major role in shop and field testing of centrifugal compressors.

Table 1
Dimensionless Parameter Assumptions

Dimensionless
Parameter1
Description Mathematical Description1
Flow coefficient Flow coefficient of the test gas and specified gas are equal using ideal and real gas methods. Equation
Work input coefficient – enthalpy method Work input coefficients of the test gas and specified gas are equal.  Ideal or real gas laws apply. Equation
Work input coefficient – isentropic or polytropic methods Work input coefficient of the test gas is corrected for the Machine Reynolds Number to obtain the specified work input coefficient.  Ideal or real gas laws apply. Equation
Efficiency –isentropic or polytropic methods The efficiency at the test operating condition is corrected by the Machine Reynolds Number to obtain the specified operating condition. Equation
Total work input coefficient – heat balance or shaft balance methods The total work input coefficient is equal for test and specified gases. Equation

NOTE:
1.     See ASME PTC-10 for complete mathematical description of the coefficients.

Basic Performance Relationships

Equations
Equations

The Code recognizes three methods of determining compressor work (also called head).  The first is the enthalpy method and is defined by Equation 2.  It represents the difference in the inlet and discharge enthalpy, and results in theactual work supplied to the gas.  The next method of determining work is by the isentropic method.  This method only determines the ideal compressor work and may be calculated utilizing Equation 3 and 4.  The last relationship for determining compressor work is the polytropic method.  Only the ideal work is found by this method and may be calculated using Equations 5 and 6.  All three methods are commonly used by compressor users and manufacturers.

Volume Ratio
The volume ratio is an important aerodynamic parameter.  It maintains similar flow conditions as gas properties and operating conditions change.  The best way to describe volume ratio is to consider a multi-stage compressor.  The mass of gas entering the first impeller must equal the mass entering other impellers.  However, the actual gas volume entering the first stage is not the same for other impellers.  The gas is compressed and heated, which results in a reduction of volume.  If the gas properties and operating conditions of the test gas are different from the specified gas, then the volume entering and leaving each stage will also be different.  Therefore, to duplicate the aerodynamic performance of a compressor at the specified design condition it is important to simulate the equivalent flow of gas through the impellers by carefully matching the volume ratio.

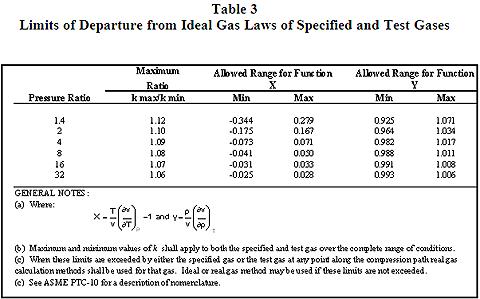
A centrifugal compressor performance test is frequently performed with a gas other than the specified gas.  In addition, the compressor may operate at conditions other than the original design.  To assure an accurate performance test that simulates the original design, the volume ratio of the specified gas must match the volume ratio of the test gas at the respective operating conditions.  Equations 1-6 can be used to determine the conditions that match the test and specified volume ratio.  The Code sets limits on deviations of the test gas properties and operating conditions, which is found in Table 2 of Part 1.

Seven variables define the volume ratio relationship between a test gas and the specified gas.  The variables and the influence each has to increase or decrease the volume ratio is shown in Table 2.  For example, if the k-value of the test gas is greater than the specified gas, the volume ratio will decrease.  Similarly, if the test gas suction temperature is less then the volume ratio will increase.  Also note another important fact, and that is changes in the suction pressure of the test gas have no effect on volume ratio.

Table 2 – Variable Influence on Volume Ratio

Variable Change Volume Ratio Change Volume Ratio
Head Increase Increase Decrease Decrease
Molecular Weight Increase Increase Decrease Decrease
Suction Temperature Increase Decrease Decrease Increase
Compressibility Increase Decrease Decrease Increase
k-value Increase Decrease Decrease Increase
Speed Increase Increase Decrease Decrease
Suction pressure Increase No change Decrease No change

As previously mentioned, the volume ratio of the specified gas must match the volume ratio of the test gas.  So if each of the physical properties of the test gas can change the volume ratio, what can be done so that the two volume ratios match?  A common practice is to change the test speed to compensate for the mismatch of volume ratios.  This practice is illustrated in Figure 1.  Note how the compressor speed is decreased so that the volume ratio changes imposed by other variables add up to zero.

Figure 1

In summary, the operating conditions and physical properties of a performance test should be carefully examined.  It is critical that the test gas volume ratio closely match the volume ratio of the specified gas.  The closer the test gas volume ratio is to the specified gas, the more accurate are the performance test results.

Mach Number
The Mach number influences the maximum amount of gas that can be compressed for a given impeller speed.  The limiting flow is known as stonewall (also called choke flow) and is typically found on the compressor characteristic head-flow curve at maximum flow condition for a given speed.  As the gas flow rate increases so does the velocity within the compressor’s internal flow path until it approaches the fluid acoustic velocity, thus limiting the flow.  Therefore, gas velocities that approach a Mach number of one indicate choke flow inside the compressor.

The Code defines a term called the Machine Mach Number which is the ratio of the outlet blade tip velocity of the first stage impeller to the acoustic velocity at inlet conditions.  The Code also sets allowable limits on the deviation between the specified and test gas Machine Mach Numbers.  This helps assure the accuracy of the performance test.  When shop testing a compressor, the Machine Mach Number at the operating condition is calculated and compared to the difference of the specified gas and test gas.  See Figure 2 for allowable deviation limits.  If the value exceeds the permitted deviation the test gas operating conditions may need adjusting to comply with to these limits.

Figure 2

Figure 2 – Allowable Deviations for Machine Mach Number

Reynolds Number
The effect that the Reynolds Number has on a compressor is similar to the effect it has on pipes.  The gas flowing through the internal passages of a compressor produce friction and energy loss which influences the machine efficiency. For centrifugal compressors, the Code defines a term called the Machine Reynolds Number and places limits on the allowable values during a performance test and is defined by Equation 8.  If the Machine Reynolds Number for the test condition and specified condition differs then a correction factor is applied to the test efficiency and head values. See Equation 9 for the correction factor.
Equation
The allowable Machine Reynolds Number departure limits between the test gas and specified gas are given in Figure 3.

By Joe Honeywell

Figure 3

Figure 3 – Allowable Machine Reynolds Number Departures
References

  1. ASME PTC-10, “Performance test Code on Compressors and Exhausters”, 1997
  2. Short Course “Centrifugal Compressors 201”, Colby, G.M., et al. 38th Turbomachinery Symposium, 2009.


Nomenclature
Nomenclature

2 responses to “Important Aspects of Centrifugal Compressor Testing – Part 2”

  1. Vinh Le says:

    As a chemical process engineer I appreciate the published articles enormously. Irrespective of one’s field of expertise to be an excellent engineer one has to have knowledge in other fields (mechanical, civil, electrical…)

  2. Finally. I’ve refined my diet to please Tsurugi. My journey is complete. Perfection is only a vague ideal. A phantom eternally chased.

Important Aspects of Centrifugal Compressor Testing-Part 1

Every centrifugal compressor, whether it is new or has been in service for many years will most likely be tested to verify its thermodynamic performance.  For a new machine the testing may be conducted in the manufacturer’s facility under strict controlled conditions or in the field at actual operating conditions.  Older compressors that have been placed in service after maintenance or have been operating for an extended period of time may require testing to verify the efficiency and normal operation.  This TOTM will review ASME PTC-10 (also referred to as the Code) testing procedure and other topics that contribute to an accurate centrifugal compressor test results.

This two-part series will review the salient aspects of a performance test.  Part 1 will review the thermodynamic performance test objectives established in the Code as well as other factors to consider in a testing procedure.  While this code is primarily applicable to shop testing it can also apply to field testing.  Part 2 will review the Code assumptions and basic performance relationships.  It will also examine the three important principles that influence the operating conditions and ultimately influence the accuracy of the performance test.  They are volume ratio, Machine Mach Number and Machine Reynolds Number.

Introduction

The purpose of a performance test is to verify that a centrifugal compressor will perform in accordance with the manufacturer’s design at the operating conditions given in the specifications.  It also provides a method of confirming the shape of the compressor head-flow curve, efficiency, and the maximum and minimum flow limits at various speeds.  Frequently a performance test is conducted under field conditions with the specified gas and operating conditions.  However, if the performance test is conducted in the shop it may not be possible to test the compressor with the specified gas because of safety concerns or testing facility limitations.  Whether the test is conducted in the field or in the shop, proof of the compressor design is recommended and often necessary to demonstrate contractual obligations and mechanical integrity.

Frequently the gas composition used to confirm a compressor performance differs from the specified gas.  This is often the case regardless if the test is conducted in the field or in the shop.  For field tests, where the gas composition and operating conditions are set by the process, adjustments must be made in the calculations to confirm the compressor design specifications.  Typically, a shop test is conducted with a carefully selected mixture of gases blended together to form a gas that has physical properties that closely resemble the specified gas.  Even with a substitute gas, differences remain which influence the test results.

The original compressor design places limits on the thermodynamic performance.  The most important of these limits include flow rate, power, temperature, pressure and speed.  There are other design restraints which are not as commonly known but will also influence the compressor performance.  Such factors are volume ratio, Mach number and Reynolds number.  These limits were incorporated in the compressor design and are influenced by gas properties, operating conditions and the mechanical design.  To verify the design and operating limits for a compressor, it is necessary to test the machine.  For new machines, these tests are commonly performed in the manufacturer’s facility; however, the testing is sometimes performed in the field.  It may also be helpful to periodically test a compressor to trend the machine performance.  Testing conducted during commissioning will establish a baseline of performance.  Periodic field tests are often conducted to verify the overall performance and signal changes that may predict mechanical damage, internal fouling, or other deteriorating conditions.

Summary of ASME PTC-10 – Performance Test Code
The procedure presented in the Code provides a method of verifying the thermodynamic performance of centrifugal and axial compressors.  This code offers two types of tests which are based on the deviation between test and specified conditions.  A detail procedure is given for calculating and correcting results for differences in gas properties and test conditions.  The following briefly describes the guiding principles of the Code.

  • Type 1 test is conducted with the specified gas at or very near to the specified operating conditions.  While the actual and test operating conditions may differ, the permissible deviations are limited.  See Table 1, 2 and 3 for deviation limits of testing variables of a Type 1 test.
  • Type 2 test is conducted with either the specified gas or a substitute gas.  The test operating conditions will often differ significantly from the specified conditions.  The operating conditions are subject to limitations based on the compressor aerodynamic design.  See Table 2 and 3 for permissible deviations of operating conditions and test gas properties.
  • The calculation method of a Type 1 and Type 2 test may conform to either Ideal or Real Gas laws.  Physical property limitations are given in Table 3 if Ideal Gas Law methodology is used.


Tables 1 and 2
Table 3

The Code also gives procedures for calculating and correcting test results for difference between the test conditions and specified conditions.  It also gives recommendations for accurate testing including compressor testing schemes, instrumentation, piping configuration and test value uncertainties.  The following summarizes each topic.

  • Thermodynamic calculations may utilize either enthalpy, isentropic or polytropic methods.  The Code provides equations and examples for determining compressor work (also referred to as head), gas and overall efficiencies, gas and shaft power, and parasitic losses.
  • The Code gives a correction procedure for test gases and test operating conditions that deviated from the specified operating conditions.
  • Compressor testing may be open-loop or closed-loop; however, the test results are subject to limits that may give preference to the test arrangement.
  • Instrumentation methods and measurement uncertainties (refer to PTC-19 series of standards) used to test compressors are given.
  • Recommendations for piping layout are also included.

Test Gas Selection
There are many gases commonly used to test compressors.  They are selected based on physical properties, toxicity, flammability and environmental concerns.  See Table 4 for a list of the most frequently used gases.  The manufacturers will sometimes blend the various gases to match the equivalency criteria and the test facilities limitations.  Following are recommendations to consider when selecting a test gas.

  • The compressor mechanical design may impose constraints on the test.  Consider the machine rotor dynamics, overspeed, maximum temperature and power limitations when selecting a test gas.
  • Avoid flow rate mismatch of impellers.  The volume ratio equivalency is the most important parameter in selecting a test gas.  This may also place limitations on the operating conditions.  More on this subject in Part 2. of this series.
  • The test gas molecular weight should closely match the molecular weight of the specified gas.
  • The test gas k-value should closely match the specified gas to duplicate the Machine Mach Number.  If this is not practical then the test k-value should be slightly greater to avoid possible stonewall limitations.
  • Select a test gas with minimum Reynolds Number deviation from the specified gas.  This will minimize the efficiency and head correction factors.  This is especially important for machines with a low Machine Reynolds Number.

Table 4
Typical Test Gas Mediums (1)

Test Gas Molecular Weight k-Value (2) Absolute Viscosity-cP (2)
Helium 4.003 1.667 0.0194
Nitrogen 28.014 1.401 0.0174
Air (dry) 28.959 1.401 0.0175
Carbon Dioxide 44.010 1.299 0.0145
R134a 102.0 1.124 0.0114
Natural Gas (4) 17.1  (3) 1.26  (3) 0.010  (3)
Propane 44.096 1.141 0.00789

Note:

  1. From “Compressors 201” course at Turbomachinery Conference, 2009
  2. Values from National Institute of Standards and Technology and Gas Processors Suppliers Association
  3. Values at 60 0F (15.6 C) and 14.696 psia (101.3 kPa)
  4. Gas composition and physical properties varies with local utility

Test Objectives
The following are some factors to consider as part of the performance test procedure.

  • API 617 requires a minimum of five test points to be taken at the operating speed to demonstrate the surge point, stonewall, required operating point and two alternate points.  The user may optionally request additional test points to verify compressor performance at alternate speeds.  For example, extra data points may be needed to verify the surge line or critical process operating conditions for variable speed machines.
  • The test may be performed as a Type 1 or Type 2 test.  Type 1 is normally more accurate and is typically reserved when test conditions can be made to closely match the specified operating conditions.  A Type 2 test is typically a shop test utilizing a substitute gas.
  • If a Type 2 test is recommended, the test gas may be a pure gas such as those listed in Table 4, or a mixture of gases.  The composition of the test gas should be agreed upon before testing.  In addition, the composition of the test gas should be sampled before, during and after the test.  Some gas mixtures tend to stratify and give erroneous results.
  • The physical properties of the test gas are critical to the outcome especially if it is a mixture of selected gases.  An agreement on the physical properties is recommended.
  • Normally an agreement is made as to the “equation of state” used to calculate the results of the test.  Not all EOS programs give the same results, nor is there industry agreement as to which method is best.
  • Discuss the specific driver used in the test.  Will a shop driver or the specified driver be used?  Will the driver be fixed or variable speed?  If it is variable speed, will it be motor, gas turbine or steam turbine?
  • If a gear is part of the test, will it be manufacturer or user supplied?  Is the efficiency of the gear known?  Tests can be performed to verify gear efficiency.
  • Will the gas be cooled with a water-cooled or air-cooled exchanger?  Is there temperature limitations on the coolant used in the test?
  • Is the allowable working pressure of equipment and piping systems adequate for the test?  Will a pressure safety valve be needed to protect the system and is it properly sized?
  • An agreement on how the input power will be measured is important.  Options include, heat balance, calibrated driver, dynamometer, and torque meter.  Review the specific method of measuring input power with the manufacturer.
  • A piping and instrument schematic is recommended.  The drawing should show details of the test loop including the placement of major equipment, number and location of instruments, and piping size.  This is especially important for compressors with multiple sections, inlet sidestream, or back-to-back configuration.
  • Before proceeding with a performance test a written procedure is recommended that outlines how the test will be conducted.  The procedure should clearly convey the scope of the test, the responsibilities of each party, test piping and instrument arrangement, measurement methods, uncertainty limits, calibration, taking of test data and how to interpret results, and acceptance criteria.

By Joe Honeywell

References

  1. ASME PTC-10, “Performance test Code on Compressors and Exhausters”, 1997.
  2. API Standard 617, “Centrifugal compressors for Petroleum, Chemical, and Gas Services Industries”, 1995.
  3. Kurz, R., Brun, K, & Legrand, D.D., “Field Performance Testing of Gas Turbine Driven Compressor Sets”, Proceeding of the 28th Turbomachinery Symposium, 1999.
  4. Short Course “Centrifugal Compressors 201”, Colby, G.M., et al. 38th Turbomachinery Symposium, 2009.
  5. National Institute of Standards and Technology, Web Site for Properties of Fluids.

2 responses to “Important Aspects of Centrifugal Compressor Testing-Part 1”

  1. Ahmed AlGazi says:

    Good day Gentlemen,
    This is Ahmed, and I’m a new master student in mechanical engineering at University of Tulsa. It is my pleasure If I have a chance to get MR.Joe’s contact infroamtion for studies purposes.

    Thanks,

  2. I consider something genuinely interesting
    about your website so I saved to favorites.

The Hybrid Hydrate Inhibition-Part 2: Synergy Effect of Methanol and KHI

Many materials may be added to water to depress the hydrate temperature. For many practical reasons, a thermodynamic hydrate inhibitor (THI) such as an alcohol or one of the glycols is injected, usually methanol, diethylene glycol (DEG) or monoethylene glycol (MEG). All may be recovered and recirculated, but the economics of methanol recovery may not be favorable in many cases. Hydrate prevention with methanol and or glycols can be quite expensive because of the high effective dosage required (10 to 60% of the water phase). Large concentrations of solvents can aggravate potential scale problems by lowering the solubility of scaling salts in water and precipitating most known scale inhibitors. The high rates of methanol create a logistical problem as well as a health, safety, and environmental (HS&E) concern because of the handling issues associated with methanol. The total injection rate of inhibitor required is the amount/concentration of inhibitor in the liquid water phase for the desired hydrate temperature suppression, plus the amount of inhibitor that will distribute in the vapor and liquid hydrocarbon phases. Any inhibitor in the vapor phase or liquid hydrocarbon phase has little effect on hydrate formation conditions.  Due to the accuracy limitations of the hydrate depression calculations and flow distribution in the process, it is recommended that the hydrate formation temperature with inhibition be chosen with a design factor below the coldest expected operating temperature of the system to ensure adequate inhibitor injection rates.

Low dosage hydrate inhibitors (LDHIs) are relatively new and only recently reaching the “proven technology” stage in oil and gas processing.  Although LDHIs move the hydrate formation line to the left, it is only temporary. In typical systems they will “delay” the formation of hydrates for about 12 hours. The LDHIs are two classes of chemicals: Kinetic inhibitors (KHIs) and Anti-Agglomerants (AAs). A KHI can prevent hydrate formation but contrary to methanol cannot dissolve an already formed hydrate. Current KHIs have a difficult time overcoming a subcooling temperature (ΔT) threshold of about 15 °C (27 °F). AAs allow hydrates to form and maintain a stable dispersion of hydrate crystals in the hydrocarbon liquid. AAs form stable water in oil micro-emulsion. AAs adsorb onto the hydrate crystal lattice and disrupt further crystal growth but must have a liquid hydrocarbon phase present and the maximum water to oil ratio is about 40-50%.

Laboratory studies and field experiences indicate hydrate-inhibition synergy is gained through the combination of a THI and LDHI [1]. This is termed a hybrid hydrate inhibition (HHI). In the June 2010 tip of the month (TOTM) we demonstrated the synergy effect of mixed THIs like NaCl and MEG solution and presented a shortcut method to estimate the synergy effect of brine and MEG solution. In this TOTM, we will discuss the results of a successful application of combined methanol and a KHI solution for a well producing natural gas, condensate and water in the Gulf of Mexico (GOM). The following sections are based on the paper presented by Szymczak et al. [1].

As mentioned earlier, THIs are used in concentration ranging from 10 to 60 weight percent in water and LDHIs are used in concentration normally less than 5 weight percent. Proper combination of THI and LDHI will result in lower injection rates of the combined inhibitor mixture while controlling hydrate formation. In addition, the combined inhibitor mixture provides the ability to dissociate any hydrates that may form. Table 2 extracted from reference [1] presents the cost comparison between LDHI and methanol for various related activities. As can be seen in this table the cost of HHI for most activities is low and medium for unit cost and volume usage.

Table 1- Cost comparison of LDHI, Methanol and HHI for an offshore application [1]

Cost Factor LDHI Methanol HHI
Unit Cost Very High Low Medium
Transportation Low High Low
Pump High High Low
Storage Low High Low
Crane Lifts Low High Low
Corrosion Low High Low
Volume Low High Medium

Field Study:

To demonstrate the synergy effect of THI plus LDHI (HHI) and to illustrate the advantage of using HHI, we will discuss the results of a field study in the GOM reported by Szymczak et al. [1]. The well production flows 5.6 km (3½ miles) through 114 mm (4½-in) flowline to a production platform where natural gas, condensate and water are separated. There was a seven-line umbilical bundle that included a 9.5 mm (3/8-in) outside diameter line for methanol and/or LDHI injection. The hydrate-inhibitor injection point was at the tree. The recent gas composition is presented in Table 2 while detailed system information is shown in Table 3.

Table 2- Field Gas Composition [1]

Component Mole %
Nitrogen 0.2045
Carbon Dioxide 0.5893
Methane 95.7432
Ethane 0.4462
Propane 0.3431
i-Butane 0.1508
n-Butane 0.1823
i-Pentane 0.1262
n-Pentane 0.1088
Hexane 0.1663
C7+ 1.9392

To inhibit hydrate formation, a sufficient rate of methanol was injected to assure hydrate-free operation. Knowing the rate of water production, methanol was injected at approximately 0.019 m3/h (5 gal/hr). The injection rates were monitored and adjusted by comparing the chemical feed-line pressure at the wellhead and the flowline pressure measured at the platform.

Monitoring pressure drop between the inlet and outlet of pipelines is an industry-wide standard method of flow assessment. Fluctuating pressure drop values provide the operator with instant information concerning flow irregularities or obstructions. Only formed and dislodged hydrates manifest as rapid pressure fluctuations, whereas flow regime change or wax and scale build up result in gradual pressure changes. The GOM facilities operating experience showed that with only methanol in the system, the pressure difference between the wellhead and the flowline at the platform changed rapidly. The differential pressure changed as much as 345 kPa (50 psi) daily and was always between 1034 and 1724 kPa (150 and 250 psi) [1].

Table 3- Flowline Data [1]

Terrain Flat
Gas Flow Rate 0.5663 x10⁶ std m3/d (20 MMSCF/D)
Line Length 5.6 km (3.5 miles)
Line Diameter 114 mm (4.5 in)
Water Flow Rate 0.023 m3/d (6 gal/day)
Condensate Traces
High Pressure 35, 853 kPa (5,200 psi)
Low Pressure 7,584 kPa (1,100 psi)
Average Pressure 27,579 kPa (4,000 psi)
Flow Speed 3.66 to 6.096 m/s (12 to 20 ft/sec)
Practical Methanol Rate 0.019 m3/h (5 gal/hr)
Sea Temperature 5 °C (41 °F)
Outlet Temperature 12.8 °C (55 °F)

Table 4 presents a summary of Szymczak et al. [1] calculation results for the worst case-scenario methanol injection rate. The relatively large dosage of methanol required was the result of a combination of temperature and gas volume conditions in the pipeline resulting in most of the injected methanol going into the vapor phase of the system at equilibrium conditions. For the detail of calculations, refer to Chapter 6, Volume 1, Gas Conditioning and Processing [2]. For methanol concentration below 25 weight percent, the Hammerschmidt [3] equation may be used. The practical 0.019 m3/h (5 gal/hr) rate of methanol applied resulted in borderline operating conditions between obstructed flow and line plugging. Szymczak et al. stated that the short fluid residence time in the flowline prevented the formation of a complete hydrate plug. Note that the high values of subcooling temperature eliminated KHI as the sole hydrate-prevention method. Known KHIs become ineffective inhibitors at approximately ΔT>15 °C (ΔT>27 °F) [1].

HHI Results

Szymczak et al. [1] reported that the inhibitor usage was reduced dramatically from 0.019 m3/h (5 gal/hr) of methanol to 0.0028 m3/h (0.75 gal/hr) of HHI and the pressure drop showed a lowering trend. They optimized the HHI dosage at approximately 0.0025 m3/h (0.67 gal/hr), a HHI rate sufficient to protect the flowline from producing hydrates in any case of rate or pressure/temperature fluctuation. This HHI rate represented an 80% reduction compared to the methanol injection rate. As a result of the injection rate reduction, the costs of transportation, pump maintenance, storage on the platform, corrosion inhibition of the flowline, labor and safety costs related to crane lifts, and pressure drop were reduced. For further detail on this field study, refer to Szymczak et al. paper [1].

Table 4- The worst case-scenario theoretical methanol injection rate requirement

Flowline Pressure Option 35, 853 kPa (5,200 psi) 27,579 kPa (4000 psi)
Hydrate depression (Subcooling) 23 °C (41.4 °F) 20 °C (36 °F)
Weight % methanol in water phase 23 20
Injection rate 0.045 m3/h (12 gal/hr) 0.035 m3/h (9.2 gal/hr)

In summary, HHI provides both thermodynamic and LDHI inhibition. From a cost standpoint, the HHI is cost-efficient compared to THIs. Additionally, the HHI can reduce corrosion and may eliminate the need for corrosion inhibitor.  From an offshore operational standpoint, the HHI significantly reduces logistical costs related to shipping, storage, handling, and chemical pumping. In addition to cost reduction, the problems related to health, safety, and environment (HS&E) would reduce too.

To learn more about similar cases and how to minimize operational problems, we suggest attending our G4 (Gas Conditioning and Processing) and G5 (Gas Conditioning and Processing – Special).

John M. Campbell Consulting (JMCC) offers consulting expertise on this subject and many others. For more information about the services JMCC provides, visit our website at www.jmcampbellconsulting.com, or email your consulting needs to consulting@jmcampbell.com.

By: Dr. Mahmood Moshfeghian

Reference:

  1. Szymczak, S., Sanders, K., Pakulski, M., Higgins, T.; “Chemical Compromise: A Thermodynamic and Low-Dose Hydrate-Inhibitor Solution for Hydrate Control in the Gulf of Mexico,” SPE Projects, Facilities & Construction, (Dec 2006).
  2. Campbell, J. M., “Gas Conditioning and Processing”, Vol. 1, The Basic Principles, 8th Ed., Second Printing, J. M. Campbell and Company, Norman, Oklahoma, (2002).
  3. Hammerschmidt, E. G. “Formation of Gas Hydrate in Natural Gas Transmission Lines”, Ind. Eng. Chem., 26, 851-855, (1934).

2 responses to “The Hybrid Hydrate Inhibition-Part 2: Synergy Effect of Methanol and KHI”

  1. Oren says:

    I see a lot of interesting articles on your website.
    You have to spend a lot of time writing, i know how to
    save you a lot of work, there is a tool that creates unique, google friendly articles in couple
    of minutes, just type in google – laranita’s free content source

  2. Do you know of any instances where LDHI was transferred (pumped) using a blowcase?

The Hybrid Hydrate Inhibition

The best way to prevent hydrate formation (and corrosion) is to keep the pipelines, tubing and equipment dry of liquid water. There are occasions, right or wrong, when the decision is made to operate a line or process containing liquid water. If this decision is made, and the process temperature is below the hydrate point, inhibition of this water is necessary.

Many materials may be added to water to depress both the hydrate and freezing temperatures. For many practical reasons, a thermodynamic hydrate inhibitor (THI) such as an alcohol or one of the glycols is injected, usually methanol, diethylene glycol (DEG) or monoethylene glycol (MEG). All may be recovered and recirculated, but the economics of methanol recovery may not be favorable in many cases. Hydrate prevention with methanol and or glycols can be quite expensive because of the high effective dosage required (10% to 60% of the water phase). Large concentrations of solvents aggravate potential scale problems by lowering the solubility of scaling salts in water and precipitating most known scale inhibitors. The total injection rate of inhibitor required is the amount/concentration of inhibitor in the liquid water phase for the desired hydrate temperature suppression, plus the amount of inhibitor that will distribute in the vapor and liquid hydrocarbon phases. Any inhibitor in the vapor phase or liquid hydrocarbon phase has little effect on hydrate formation conditions.  Due to the accuracy limitations of the hydrate depression calculations and flow distribution in the process, it is recommended that the hydrate formation temperature with inhibition be chosen with a design factor below the coldest expected operating temperature of the system to ensure adequate inhibitor injection rates.

Determination of the amount and concentration of inhibitors and their distribution in different phases are very important for practical purposes and industrial applications. Therefore, to determine the required amount and concentration of these inhibitors, several thermodynamic models for hand and rigorous calculations have been developed and incorporated into computer software.

Low dosage inhibitors are relatively new and only recently reaching the “proven technology” stage in oil and gas processing.  Although these systems move the hydrate formation line to the left, it is only temporary.  In typical systems they will “delay” the formation of hydrates for about 12 hours. Low Dosage Hydrate Inhibitors (LDHIs) are two class of chemicals: Kinetic inhibitors (KHIs) and Anti-Agglomerants (AAs). A KHI can prevent hydrate formation but cannot dissolve an already formed hydrate. Current KHIs have a difficult time overcoming a subcooling temperature (ΔT) threshold of 15 °C (27 °F). AAs allow hydrates to form and maintain a stable dispersion of hydrate crystals in the hydrocarbon liquid. AAs form stable water in oil micro-emulsion. AAs adsorb onto the hydrate crystal lattice and disrupt further crystal growth but must have a liquid hydrocarbon phase and the maximum water oil ratio is about 40-50%.

Laboratory studies and field experiences indicate hydrate-inhibition synergy is gained through the combination of two or more THIs [1] or THI and LDHI [2]. This is termed a hybrid hydrate inhibition (HHI).

In this TOTM we will demonstrate the synergy effect of mixed THIs like NaCl and MEG solution. In the next TOTM, we will discuss the results of a successful application of combined methanol and a KHI solution for a well producing natural gas, condensate and water in the Gulf of Mexico (GOM).

Combined THIs (MEG + NaCl or MEG + KCl)
The produced water from natural gas reservoirs contains an electrolyte solution such as NaCl, KCl, and CaCl2. In order to estimate the hydrate formation temperature in the presence of mixed thermodynamic inhibitors, we propose to add up the depression temperature due to each individual inhibitor. The steps are summarized below:

  1. Using a conventional method described in reference [3], estimate the hydrate formation temperature in the presence of pure water, To.
  2. Using a method similar to Javanmardi et al. [1], estimate the hydrate depression temperature due to the presence of salt solution, salt ΔT.
  3. Using a method similar to Hammerschmidt [4], estimate the hydrate depression temperature due to the presence of MEG solution, MEG ΔT.
  4. Add up Salt ΔT and MEG ΔT, Total ΔT.
  5. The hydrate formation temperature is calculated by subtracting total ΔT from To.

As an example, Table 1 presents the detail of calculation and the contribution of each inhibitor to the hydrate formation temperature for methane gas at different pressures and mixed inhibitor concentration. Comparison of the estimated hydrate formation temperature (last column of Table 1) with the experimental data (the fifth column) measured by Masoudi et al. [5] indicates a relatively good agreement. Figures 1 and 2 also present the contribution of each inhibitor to the hydrate formation temperature as described above for mixed solution of NaCl + MEG and KC l+ MEG, respectively.

Table 1

Figures 1 and 2

Table 2 presents a comparison between the accuracy of the proposed method with Javanmardi et al. method against the experimental data for methane gas in the presence of mixed inhibitors. Table 2 also indicates an average absolute temperature difference of 4.7 and 3.5 °C for the proposed method and Javanmardi et al. method, respectively.

Table 2

In summary, a simple procedure is proposed for estimation of the hydrate formation temperature in the presence of mixed THIs such as MEG plus a salt solution. This procedure can be used for a mixture of glycol and electrolyte solutions. The procedure is relatively simple and its accuracy is good enough for facility calculations. For more accurate prediction of hydrate formation temperature in the presence of electrolytes, the readers should refer to the papers presented by Javanmardi et al. [1] and Masoudi et al. [5].

Figures 3 and 4

To learn more about similar cases and how to minimize operational problems, we suggest attending our G4 (Gas Conditioning and Processing) and G5 (Gas Conditioning and Processing – Special) courses.

John M. Campbell Consulting (JMCC) offers consulting expertise on this subject and many others. For more information about the services JMCC provides, visit our website at www.jmcampbellconsulting.com, or email your consulting needs to consulting@jmcampbell.com.

By: Dr. Mahmood Moshfeghian

Reference:

  1. Javanmardi, J., Moshfeghian, M. and R. N. Maddox, “An Accurate Model for Prediction of Gas Hydrate Formation Conditions in Mixture of Aqueous Electrolyte Solutions and Alcohol,”Canadian J. of Chemical Engineering, 79, 367-373, (2001).
  2. Szymczak, S., Sanders, K., Pakulski, M., Higgins, T.; “Chemical Compromise: A Thermodynamic and Low-Dose Hydrate-Inhibitor Solution for Hydrate Control in the Gulf of Mexico,” SPE Projects, Facilities & Construction, (Dec 2006).
  3. Campbell, J. M., “Gas Conditioning and Processing”, Vol. 1, The Basic Principles, 8th Ed., Second Printing, J. M. Campbell and Company, Norman, Oklahoma, (2002).
  4. Hammerschmidt, E. G. “Formation of Gas Hydrate in Natural Gas Transmission Lines”, Ind. Eng. Chem., 26, 851-855, (1934).
  5. Masoudi, R., Tohidi, B., Anderson, R., Burgass, R., and Yang, J. “Experimental Measurement and Thermodynamic Modelling of Clathrate Hydrate Equilibria and Salt Solubility in Aqueous Ethylene Glycol and Electrolyte Solutions,” Fluid Phase Equilibria, 219, 157-163 (2004).

5 responses to “The Hybrid Hydrate Inhibition”

  1. rostami says:

    بسمه تعالی
    با عرض سلام و خسته نباشید
    خدمت با سعادت استاد گرانقدر
    جناب آقای دکترمشفقیان
    احتراما، اینجانب خدیجه رستمی دانشجوی کارشناسی ارشد مهندسی شیمی در دانشگاه سمنان می باشم که موضوع پایان نامه بنده،بررسی هم افزایی بازدارنده های هیدرات گازی است.
    خواهشمندم در صورت امکان بنده را در این زمینه، با توجه به منبع دانش وسیع خوددر این زمینه یاری فرمایید
    با نهایت سپاس گزاری
    رستمی

  2. Appreciating the dedication you put into your website and detailed
    information you provide. It’s good to come across a
    blog every once in a while that isn’t the same unwanted rehashed material.
    Fantastic read! I’ve saved your site and I’m including your RSS feeds to my Google
    account.

  3. Toby Griesi says:

    There’s definately a great deal to find out about this topic. I love all the points you’ve made.

  4. I love looking through and I conceive this website got some really useful stuff on it! .

  5. Nigel Jiménez says:

    Can use this aproach for gas inyection well?
    In Peru have a field where we inyect gas from a platform to other platform through 1 mille pipeline (inyection gas well, whp= 3000 psi) and everyday the compressors shut down for high pressure discharge because hydrates block pipeline. Actually we are pumping Methanol. Can we add salt?

Distribution of Sulfur-Containing Compounds in NGL Products by Three Simulators

In the February 2010 tip of the month (TOTM) we presented the distribution and concentration of sulfur-containing compounds in an NGL Fractionation (NF) plant using HYSYS [1] with the Peng-Robinson equation of state (PR EOS) [2]. In this TOTM we will present the distribution and concentration of the sulfur-containing compounds in the same NF plant using ProMax [3] and VMGSim [4] both using the PR EoS. These two simulation results will be compared with the HYSYS [1] results. The software’s built-in binary interaction parameters were used in this study. The NF plant is the same as the one described by Alsayegh et al. [5]. The feed composition, rate, condition, and product specifications are shown in Tables 1 and 2 and the plant process flow diagram is shown in Figure 1 of the February 2010 TOTM. An overall tray efficiency of 90 percent was used for all columns.

Figure 1

Expected Product Distribution: Figure 1, reproduced from Figure 9 of a paper published by Likins and Hix [6], shows a descending order log scale bar-graph of the pure compounds vapor pressure for the components of interest to this study. This figure shows that COS should distribute to both the ethane and the propane streams. MeSH, with a vapor pressure close to n-butane should distribute primarily with the butanes with a small amount distributing to the pentane stream. EtSH, having a vapor pressure between butane and pentane, should distribute primarily with butane and pentane. CS2 should distribute primarily to the pentane and the C6+ streams with only minor distribution to the butane stream. The heavier sulfur compounds should end up almost entirely in the C6+ stream.

Results of Computer Simulation:

The NF plant described in the previous section was simulated using HYSYS [1], ProMax and VMGSim based on the PR EOS [2]. In this study, the respective software built-in (library) binary interaction parameters were used even though we recommend evaluating the accuracy of VLE results against experimental data and if necessary the insertion of VLE data regression into the EOS interaction parameters. This regression may be required to adequately model the systems dealing with mercaptans.

  1. Table 1. Concentration (PPM, mole) of sulfur containing compounds in the gas and product streams
Table 1

The focus of this study is on the distribution (% recovery) and concentration (PPM) of the sulfur-containing compounds in the product streams. Table 1 presents the PPM concentration of sulfur-containing compounds in the feed and product streams. Figures 2 through 8 present bar-graphs of the recovery of each sulfur-containing compound in the gas and product streams. The mole percent recovery is defined as the number of moles of a component in the product stream divided by the moles of the same component in the feed stream (Stream 5). In these figures, the gas and product streams are followed by letters H, P, and V representing HYSYS, ProMax, and VMGSim results, respectively.

H2S: Figure 2 shows the distribution and recovery of H2S in the gas, C2 and C3 product streams. As expected, the majority of the H2S distributes in the gas and the C2 product streams. As can be seen in this figure, the results of the simulators are the same.

Figure 2

COS: Figure 3 shows the distribution and recovery of COS in the gas, C2, and C3. As expected, the majority of the COS ends up in the C3 product stream. As can be seen in this figure, the results of the three simulators are almost the same.

Figure 3

MeSH: Figure 4 shows the distribution and recovery of MeSH in the gas, C3, and C4 product streams. For HYSYS and VMGSim, contrary to the data presented in Figure 1, the majority of the MeSH distributes to the C3 stream rather than to the C4 stream. However, the ProMax result follows the same trend as in Figure 1 and the majority of MeSH distributes to the C4 stream.

Figure 4

EtSH: Figure 5 shows the distribution and recovery of EtSH in the C3, C4, and C5 streams. Unexpectedly, HYSYS predicts that the majority of the EtSH ends up in the C4 stream rather than the C5 product as would be expected based on the data of Figure 1. However, the results of ProMax and VMGSim are closer to the Figure 1 data.

Figure 5

CS2: Figure 6 shows the distribution and recovery of CS2 in the C4 and C5 product streams. Contrary to the Figure 1 pure CS2 behavior the results of HYSYS and VMGSim show that the majority of the CS2 ends up in the C4 stream. However, based on the ProMax results, the majority of the CS2 ends up in the C5 stream which is consistent with data in Figure 1.

Figure 6

iC3SH: Figure 7 shows the distribution and recovery of iC3SH in the C4, C5 and C6+ product streams. As expected, iC3SH ends up in the C5 and C6+ streams. Notice that ProMax shows a higher concentration of iC3SH in the C5 product stream while HYSYS and VMGSim predict lower but nearly the same recovery of iC3SH.

Figure 7

iC4SH: Figure 8 shows recovery of iC4SH in the C6+ product stream. All of the iC4SH ends up in the C6+ stream as expected when the Figure 1 data is analyzed.

Figure 8

Conclusions:

The calculation results presented and discussed here are specific to the NGL fractionation plant studied here, but there are some general conclusions that can be drawn from this study.

The results indicate that the highest concentration of methyl mercaptan (MeSH) is present in the C3 product (stream 15) based on HYSYS and VMGSim but its highest concentration is in the C4 product (stream 20) based on the ProMax results.

The results of HYSYS indicate that the highest concentration of ethyl mercaptan (EtSH) is present in the C4 product (stream 20) but ProMax and VMGSim results indicate that its highest concentration occurs in the C5 Product (stream 23).

The highest concentration of carbon disulfide (CS2) is present in C5 Product (stream 23) according to the three simulator results.

The binary interaction parameters used in the EOS play an important role in the VLE behavior of the system under study, and affect the distribution of the sulfur-containing compounds present in the feed. Use of improper or incorrect binary interaction parameters may generate erroneous results. Care must be taken to use correct values of binary interaction parameters. In this study, the simulator library values of the binary interaction parameters were used.

The predictions by HYSYS, ProMax, and VMGSim in Figures 4 through 7 (showing the distribution of MeSH, EtSH, CS2, and iCH3SH respectively) contain some disagreements. The results also indicate that these compounds were not distributed among the hydrocarbon products in the same way one would expect from their volatilities and concentrations. This may be explained by the conclusion reported by Harryman and Smith [7, 8] who wrote “iC3SH is formed during fractionation within the depropanizer and the deethanizer.” Therefore, further evaluation should be conducted to arrive at a concrete decision. In an upcoming TOTM, we will investigate the VLE behavior of the theses systems using experimental data. This should be a good reason to perform laboratory tests and detailed thermodynamic calculations to determine process flow rates and composition. Detailed process analysis shouldalways be made to justify and prove correct decisions as to selection of process flow schemes.

To learn more about similar cases and how to minimize operational problems, we suggest attending the John M. Campbell courses; G4 (Gas Conditioning and Processing)G5 (Gas Conditioning and Processing – Special) and G-6 Gas Treating and Sulfur Recovery.

John M. Campbell Consulting (JMCC) offers consulting expertise on this subject and many others. For more information about the services JMCC provides, visit our website at www.jmcampbellconsulting.com, or email your consulting needs to consulting@jmcampbell.com.

By: Dr. Mahmood Moshfeghian

Reference:

  1. ASPENone, Engineering Suite, HYSYS Version 7.0, Aspen Technology, Inc., Cambridge, Massachusetts U.S.A., 2009.
  2. Peng, D.,Y. and D. B. Robinson, Ind. Eng. Chem. Fundam. 15, 59-64, 1976.
  3. ProMax 3.1, Bryan Research and Engineering, Inc, Bryan, Texas, 2009.
  4. VMGSim 5.0.5, Virtual materials Group, Inc, Calgary, Alberta, 2010.
  5. Al-Sayegh, A.R., Moshfeghian, M.  Abbszadeh, M.R., Johannes, A. H. and R. N. Maddox, “Computer simulation accurately  determines volatile sulfur compounds,” Oil and Gas J., Oct 21, 2002.
  6. Likins, W. and M. Hix, “Sulfur Distribution Prediction with Commercial Simulators,” the 46th Annual Laurance Reid Gas Conditioning Conference Norman, OK 3 – 6 March, 1996.
  7. Harryman, J.M. and B. Smith, “Sulfur Compounds Distribution in NGL’s; Plant Test Data – GPA Section A Committee, Plant design,“ Proceedings 73rd GPA Annual Convention, New Orleans, Louisiana, March, 1994.
  8. Harryman, J.M. and B. Smith, “Update on Sulfur Compounds Distribution in NGL’s; Plant Test Data – GPA Section A Committee, Plant design,“ Proceedings 75th GPA Annual Convention, Denver, Colorado, March, 1996.

3 responses to “Distribution of Sulfur-Containing Compounds in NGL Products by Three Simulators”

  1. Maria says:

    Dr. Mahmood, this is a very interesting and practical post. I notice that, in practice, MeSH would distribute to propane and butane, even though based on vapor pressure alone it should go to butane and heavier fractions. This is because of the non-ideality behavior of MeSH.

    • Maria;
      There is no question that the non-ideal behavior influences the distribution of mercaptans. However, simple rules such as Raoult’s law and boiling point distribution provide useful guide and point us to the right direction. Hopefully with current research underway and collection of more experimental data we find more accurate and firm conclusion.

      • Maria says:

        Dear Dr Mahmood, I am from VMG Europe and I have reproduced the simulation in this post. It is found that by using VMGSim we are able to capture the non-ideal behavior of MeSH, along with the ideal behavior of other sulfur containing compounds.

        This result is backed up by several qualitative scientific paper. Hopefully the future research will be able to give a more quantitative experimental data. Thank you for the post and the reply, hope everything goes well with you.