Three Simple Things to Improve Process Safety Management

In this Tip of the Month, we look at how to deal with some of the challenges of managing process safety.  This TOTM is an excerpt of a paper presented by JMC Instructor/Consultant, Clyde Young at the 2008 Mary K. O’Connor Process Safety Symposium.  This TOTM continues where the February 2009, TOTM left off.

When there are newspaper accounts of process incidents that have occurred, there is usually a statement along the lines of, “It just happened with no warning.”  There are warning signs for every incident. Latent failures exist in all processes and eventually lead to active failures when circumstances align.   Personnel must be taught how to see and react to these warning signs.

Throughout the lifecycle of a process, many tasks are performed.  Even when a process is running in “normal” mode, operators perform routine tasks and maintenance to keep the process at “normal”.  Now and then, the process is shut down for maintenance and then started again.  Every time a task is performed there is the possibility that a latent condition may expose itself and lead to an active failure.  Many organizations have implemented a requirement that all job tasks be analyzed through a process known as Job Task Analysis (JTA), Job Safety Analysis (JSA), or Job Hazard Analysis (JHA).  There are many titles and acronyms for this process, but all have one common theme.  Analyze the task to be performed, identify hazards and mitigate those hazards.  Sadly, these analyses become routine and the documentation associated with them becomes nothing more than a checklist that needs to be filled out and turned in.   This is sometimes known as “pencil whipping” the form.

Performing a job hazard analysis is not difficult, but does need to be a formalized process that controls or eliminates the hazards identified.  This is the third simple thing we can do to improve our process safety management systems.


Review the checklist below:

  • PROCEDURES
  • What are the procedures for the task?
  • What is unclear about the procedures?
  • What order will we use these procedures?
  • What permits are needed for hazard controls?
  • EQUIPMENT AND TOOLS
  • What are the right tools for the job?
  • What is the correct way to use them?
  • What is the condition of each tool?
  • POSITIONS OF PEOPLE
  • What could we be struck by?
  • What could we strike ourselves against?
  • What can we get caught in/on/between?
  • What are potential trip/fall hazards?
  • What are potential hand/finger pinch points?
  • What extreme temperatures will we be in/around?
  • What are the risks of inhaling, absorbing, swallowing hazardous substances?
  • What are the noise levels?
  • What electrical current/energized system could we come in contact with?
  • What would be a cause for overexerting ourselves?
  • PERSONAL PROTECTIVE EQUIPMENT (PPE)
  • What is the proper PPE?

Hard hat, glasses/goggles, ear plugs, gloves, steel toe boots, respiratory system, fire retardant clothing

  • CHANGING THE COURSE OF WORK
  • What would cause us to have to stop or rearrange the job?
  • What would cause us to change our tools or equipment?
  • What would cause us to have to change our position?
  • What would cause us to have to change our PPE?

YOU HAVE THE RIGHT AND
THE OBLIGATION TO

STOP UNSAFE ACTS


The above checklist is being used by a major oil and gas production company and has become a key element of how they do things.  In other words, it is part of their culture.  Contractors working for this company have begun using the checklist to analyze the tasks they perform.

The procedure for using the checklist is simple.  All personnel assigned to perform a task will gather for a meeting.  Each person has a copy of this checklist and one person will be assigned to document the findings of the meeting.  A leader is assigned and the leader begins asking the questions, in the order written.  The group answers each question and all the answers are documented.  This is vital because if the process is not documented, it did not happen.  Each group member follows along with the checklist and it is their responsibility to insure that the leader does not skip a question or that any member does not fail to answer a question.

Consider the first question, “What are the procedures for the task?”  Answering this question will require that the appropriate procedures are gathered.  The second question, “What is unclear about the procedures?” will insure that all personnel have reviewed the procedures.  If there is no written procedure, then one must be created.

As the checklist is reviewed and each question answered and documented, a thorough review of the job will be conducted and any hazards or issues identified will be mitigated or addressed.  In the end, all personnel will become more competent at identifying and mitigating hazards.  Latent failures may be exposed and the job can proceed safely.

Some may say, “Wait a minute here.  Conducting JHAs is usually considered a personnel safety issue and we know that having a good personnel safety record does not indicate effective process safety.”  This is true, but one of the elements of risk based process safety is safe work practices.  On many occasions, process incidents begin with routine job tasks that are not performed correctly.  Using the JHA checklist according to a formalized procedure yields several benefits.  Personnel performing the jobs have the necessary procedures for performing the task. The procedures are reviewed to insure accuracy. Procedures are identified for development. Training issues are identified for personnel who do not understand the procedures or task. Hazards that are not readily apparent are identified and mitigated before the job. Latent failures are identified and addressed. Deviations from “normal” can be predicted and addressed early in a project or task.  Even if an organization has implemented a global JHA process, local management can use this JHA checklist to enhance the organization’s process.

Performing a JHA with this checklist may be a bit time consuming at first.  As personnel become more familiar with and practice the process, the time required will be reduced.  The analysis of each job will take as long as necessary to do a thorough review.  Even though production pressures are always part of every job, whatever time is required to do an effective analysis will be worth it.

The three simple things presented in this paper are meant to be implemented at the process/plant level, not at the global level of an organization.  Implementing them at the process and plant level is much like a pilot project and the process of implementation can be more easily fine tuned.   Effective process safety management system implementation and maintenance can be difficult and time consuming.  These simple things can be modified as personnel become more competent and thus make management of process safety more efficient and effective.

The Center for Chemical Process Safety (CCPS) book, “Guidelines for Risk Based Process Safety”, concludes with the following [1]:

“Standing still, congratulating ourselves on the successes of the past 20 years, and celebrating accidents that did not occur because of all of our hard work, will not prevent the next accident.  Improvement will always be necessary. We must choose between moving forward, standing still, or slipping backward.  We need not debate which direction to choose, only embrace the opportunity for each company to make a risk informed decision regarding which forward path leads more directly to the ultimate goal of a safe, effective, and economically competitive operation.”

Too often it is heard that the reason something is done a certain way is because it’s always been done that way.  That does not mean the way things are done is correct or efficient.  These three simple things may seem onerous at first, but they do not have to be permanent changes.  They only need to be implemented long enough to insure personnel are competent and efficient at process safety.  This is especially important when it is considered that over the next 10 years it is estimated that the oil and gas industry will be required to replace everyone who was hired in the early 1980’s.

The next generation of workers in our industry needs to be given every opportunity to become competent at process safety.

If you would like a copy of the paper that was presented, please contact John M. Campbell & Co. and request a copy.

To learn more about managing process safety systems, we suggest attending our PetroSkills HSE course, HS 45- Risk Based Process Safety Management or schedule a session of our two day Process Safety Case Study for Operations and Maintenance – OT 21, which can be found in our catalog.  To enhance process safety engineering skills we suggest any of the JMC foundation courses or  of our newly developed,  PS 4 – Process Safety Engineering course.

By: Clyde Young
Instructor/Consultant

Reference:

Comments are closed.

The parameters affecting a phase envelope in the dense phase region

Because phase envelope generation and its impact on design and performance of gas processing plants is so important it has been the topic of several Tips Of The Month (TOTM). As emphasized by Rusten et al. [1], there are several challenges that have to be addressed in order to succeed with the phase envelope modeling of real natural gases. The most important are:

  1. Sampling procedures
  2. Sample preparations
  3. Chromatographic gas analysis. A detailed composition is required for satisfactory input to thermodynamic models
  4. Thermodynamic models that correctly predict the phase envelope

In this TOTM we will demonstrate the impact of thermodynamic modeling for rich gases in the dense phase region. For a discussion on the dense phase, please see the January 2010 TOTM. The value of the dense phase viscosity is very similar to gas phase viscosity. The dense phase density is closer to the liquid phase density. Therefore, it has become attractive to transport rich natural gas in the dense phase region. In October 2005 we discussed several methods of C7+ (heavy ends) characterization and checked the accuracy of several methods and presented tips to improve the accuracy of each method. These methods are presented briefly below. For more detail, please refer to Gas Conditioning and Processing, Volume 3, Advanced Techniques and Applications [2].

Method A: The C7+ is treated as a single hypothetical component based on its molecular weight (MW) and specific gravity (SG). The normal boiling point is predicted; the critical temperature, critical pressure, and acentric factor are also predicted using correlations similar to the ones by Riazi and Duabert [3].

Adjusting MW (or Tc) in Method A: By adjusting the molecular weight of the C7+ fraction we can closely match the measured dew point. The critical temperature (Tc) can also be adjusted to make the phase envelope curve pass through the measured dew point. The Tc adjustment is preferred because less work is involved to match the calculated and experimental values.

Method B: The C7+ is broken into Single Carbon Numbers (SCN) ranging from SCN 7 to SCN 17+ using the exponential decay procedure presented by Katz [4] and applied by others [5-7].

Method C: The large number of SCN components of Method B may be lumped into 4 cuts. The properties of the lumped cuts are estimated from the individual SCN components.

Method D: This method is similar to Method B except that 12 normal parafins (alkanes) are used to represent the C7+instead of SCN components. The advantage of this method is that n-alkane components are readily available in many commercial software packages but the SCNs may not be.

Tuning MW in Method D: The distribution (i.e. mole %) of the alkane part of the C7+ depends on the assumed value of the C7+ MW.

Tuning the binary interaction parameters, kij, in Methods B and C: A common correlation to estimate the binary interaction parameter is:

Equation 1

In the above equation, νci and νcj represent the critical volumes of components i and j, respectively. The default value of exponent n is normally set to 1.2 but it can be used as a tuning parameter to match the experimentally measured dew point.

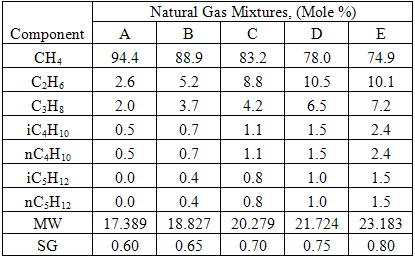
In this TOTM we will generate the dew point curve for the rich gas shown in Table 1 using the C7+ characterization methods described above. The dew point curve portion of the phase envelope for this gas was generated using both HYSYS [8] and ProMax [9] simulation software by the Soave-Redlich-Kwong (SRK) [10] (Figure 1) and Peng-Robinson (PR) [11] (Figure 2). The experimentally measured dew point pressure [12] is also show in these two figures as a red triangle.

Table 1

Figure 1

Figure 2

Figures 1 and 2 were generated using a single C7+ cut with the relative density and molecular weight shown in Table 1. Other required properities were estimated using the default options of the simulation software. As can be seen in these figures using the PR Equation of State with ProMax gives the closest prediction of the experimentally measured dew point. As decribed above the MW can be adjusted to match experimantal and calculated data.

The single carbon number (SCN) analysis as described in Method B above was used for further tuning of the thermodynamic model, The predidicted dew point pressures for the different cases studied here are shown in Table 2. Figure 3 demonstrates the same information graphically.

Table 2

Using Method B, the experimental dew point is most closely represented using four SCNs with a combined molecular weight of 118.2. The properties and mole percent distribution of these four SCN components for the optimum case are given in Table 3.

Table 3

Table 4 shows the improvement made in the dew point prediction by using four SCNs with a modified molecular weight of 118.2 instead of a single C7+ cut. The ProMax PR EOS is used for both cases. The predicted dew point curves for these two cases can be seen in Figure 4.

Table 4

Figure 3

As can be seen in Figure 4, proper characterization of the heavy components (see Tables 3 and 4) can improve the quality of the phase envelope and match the experimentally measured dew point in the dense phase region. For a detailed discussion of this topic, the readers may refer to the Rusten et al. paper [1].

To learn more about similar cases and how to minimize operational problems, we suggest attending the John M. Campbell courses; G4 (Gas Conditioning and Processing) and G5 (Gas Conditioning and Processing – Special).

John M. Campbell Consulting (JMCC) offers consulting expertise on this subject and many others. For more information about the services JMCC provides, visit our website at www.jmcampbellconsulting.com, or email your consulting needs to consulting@jmcampbell.com.

By: Dr. Mahmood Moshfeghian

Figure 4

Reference:

  1. Rusten, B.H., Gjertsen, L.H., Solbraa, E.,  Kirkerød, T., Haugum, T. and Puntervold, s., “Determination of the phase envelope – crucial for process design and problem solving,” presented at the 87th GPA National Convention, Grapevine, 2008
  2. Maddox, R. N. and L. Lilly, “Gas Conditioning and Processing, Computer Applications for Production/Processing Facilities,” John M. Campbell and Company, Norman, Oklahoma, 1995.
  3. Riazi, M.R. and T.E. Daubert, Hydr. Proc. P. 115, (March) 1980
  4. Katz, D. J. Petrol. Technol., 1205-1214, (June) 1983.
  5. Whitson, C. H. SPE J., 683-694, (August) 1983
  6. Starling, K. E. Presented at the American Gas Association Operations Conference, Orlando, FL, April 27-30, 2003
  7. Moshfeghian, M., Maddox, R.N., and A.H. Johannes, “Application of Exponential Decay Distribution of C6+ Cut for Lean Natural Gas Phase Envelope,” J. of Chem. Engr. Japan, Vol  39, No 4, pp.375-382, 2006
  8. ASPENone, Engineering Suite, HYSYS Version 7.0, Aspen Technology, Inc., Cambridge, Massachusetts U.S.A., 2009.
  9. ProMax®, Bryan Research & Engineering Inc, Version 3.2, Bryan, Texas, 2009
  10. Soave, G., Chem. Eng. Sci. 27, 1197-1203, 1972.
  11. Peng, D.,Y. and D. B. Robinson, Ind. Eng. Chem. Fundam. 15, 59-64, 1976.
  12. Sage, B.H, and R.H. Olds, AIME 170, 156–173, 1947.

1 response to “The parameters affecting a phase envelope in the dense phase region”

  1. Patrick says:

    you can tune C6+ weight fractions in several ways, a limit with these methods is that a complete set of vle points is required,
    for phase diagrams in addition to Promax and Hysys I would mention also Prode Properties, see http://www.prode.com for a free copy.

Distribution of Sulfur-Containing Compounds in NGL Products

Natural gas liquids (NGLs) consist of the hydrocarbon components in a produced gas stream that can be extracted and sold. Common NGL products are ethane (C2H6), propane (C3H8), butanes (iC4H10 and nC4H10) and natural gasoline (C5+).  Ethane is the lightest NGL and its recovery can be justified in those areas where a ready petrochemical market and a viable transportation network exist. Ethane is mainly used as a petrochemical feedstock. Propane is used for petrochemical feedstock, and also finds wide application as a domestic and industrial fuel. Propane is frequently sold as a mixture of propane and butane called LPG (Liquefied Petroleum Gas).

The market for butanes is primarily as a petrochemical feedstock, fuel and/or for gasoline blending when vapor pressure requirements allow it. Isobutane (iC4) is the most valuable of the NGLs. Its primary use is as refinery feedstock for manufacture of high octane blending components for motor gasoline. Normal butane can be used as a feedstock to olefin plants where it is converted to mono-olefins (ethylene and propylene) and the diolefin, butadiene as well as other by-products. The largest use for isobutane is as a gasoline blending component for octane number and vapor pressure control. Natural gasoline refers to the pentanes and heavier components in a gas stream and they are also commonly referred to as condensate or naphtha; it usually consists primarily of straight and branched chain paraffins. Natural gasoline is most commonly used as refinery feedstock, although it can also be used as a petrochemical feedstock. The details of the processes required, and the principles of their operation are discussed in Maddox and Lilly [1], and Maddox and Morgan [2]. A summary about the distribution of sulfur-containing compounds is presented on pages of 287-291 [2].  Specifically, page 290 presents the conclusions from the papers presented by Harryman and Smith [3, 4] which highlight the complexity of sulfur-containing distribution in the NGL product streams.

Raw NGL feed to an NGL fractionation (NF) plant may contain sulfur-containing compounds such as carbonyl sulfide (COS), methyl mercaptan (MeSH), ethyl mercaptan (EtSH), carbon disulfide (CS2), isopropyl mercaptan (iC3SH), isobutyl mercaptan (iC4SH), etc. For the purpose of meeting NGL products specification, it is important to accurately determine the distribution and concentration of the various mercaptans during NF process.

Likins and Hix [5] evaluated the accuracy of four commercial simulation programs by comparing their predicted K-values with the experimentally measured values. They concluded that “In this limited evaluation against laboratory VLE data, no one program can be claimed to be an outstanding winner. Although simulator D does an excellent job with one system, it poorly predicts behavior in the second system and is surpassed by simulator B. Simulator C behaves erratically in that its predictions range from excellent to horrible (dimethyl sulfide) depending on the component.” They also simulated two different NF plants using commercial simulation programs and compared the distribution and concentration of mercaptans in different product streams with field data.  Again, they concluded that none of the simulators do a good job modeling the sulfur distribution overall.

In order to improve the accuracy of commercial simulators, Alsayegh et al. [6] presented a procedure to determine the binary interaction parameters between mercaptans and hydrocarbons using experimentally measured vapor-liquid equilibria (VLE).

In this tip of the month (TOTM), we will determine the distribution and concentration of different mercaptans in an NGL fractionation plant using HYSYS [7] Peng-Robinson [8] equation of state. The built-in HYSYS binary interaction parameters were used in this study. The NF plant is the same as the one described by Alsayegh et al. [6]. The feed composition, rate, and condition are shown in Table 1 [6] and the plant process flow diagram is shown in Figure 1 [6].

Table 1

Figure 1

The column specifications are shown in Table 2 [6].  An overall tray efficiency of 90 percent was used for all columns. In the last column of Table 2, DV and D represent the vapor and the total rate of the overhead stream, respectively. Therefore, the DV/D is the vapor fraction in the overhead product stream. In addition, reflux ratio (L/D) is defined as the reflux rate (L) divided by the total overhead stream rate.

Table 2

Expected Product Distribution: Figure 2, reproduced from Figure 9 of Likins and Hix paper [5], shows a descending order log scale bar-graph of the pure compounds vapor pressure for the components of interest to this study. This figure shows that COS should distribute to both the ethane and the propane streams. MeSH, with a vapor pressure close to n-butane should distribute primarily with the butanes with a small amount distributing to the pentane stream. EtSH, having a vapor pressure between butane and pentane, should distribute primarily with butane and pentane. CS2should distribute primarily to the pentane and the C6+ streams with only minor distribution to the butane stream. The heavier sulfur compounds should end up almost entirely in the C6+ stream.

Figure 2

Results of Computer Simulation:

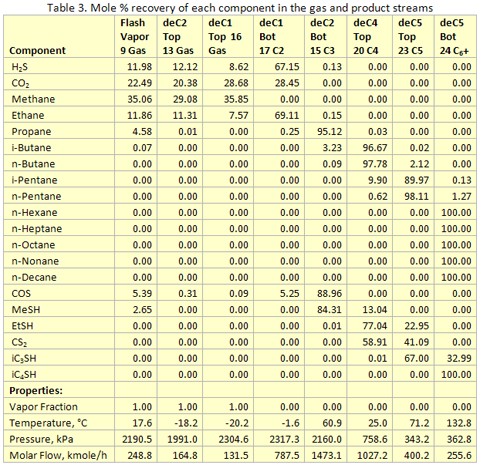
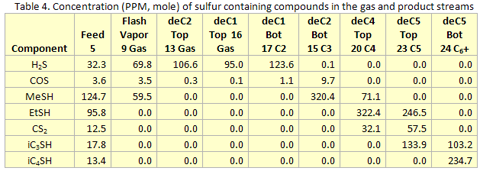
The NF plant described in the previous section was simulated using HYSYS [7] based on the Peng-Robinson equation of state (EOS) [8]. In this study, the HYSYS built-in binary interaction parameters were used even though we recommend insertion of VLE data regression into the EOS interaction parameters. This regression is required to adequately model the systems dealing with mercaptans. Table 3 presents the mole percent recovery of each component in the product and gas streams predicted by HYSYS. The mole percent recovery is defined as the number of moles of a component in the product stream divided by the moles of the same component in the feed stream (Stream 5). Table 3 also presents the vapor fraction, temperature, pressure, and flow rate of each stream. The focus of this study is on the distribution (% recovery) and concentration (PPM) of the sulfur-containing compounds in the product streams. Table 4 presents the PPM concentration of sulfur-containing compounds in the product streams.

Table 3

Table 4

Figures 3 through 9 present bar-graphs of the recovery of each sulfur-containing compound in the product streams.

H2S: Figure 3 shows the distribution and recovery of H2S in the gas, C2 and C3 streams. As expected, the majority of the H2S distributes in the gas and the C2 streams.

Figure 3

COS: Figure 4 shows the distribution and recovery of COS in the gas, C2, and C3. As expected, the majority of the COS ends up in the C3 stream.

Figure 4

MeSH: Figure 5 shows the distribution and recovery of MeSH in the gas, C3, and C4 streams. Contrary to the data presented in Figure 2, the majority of the MeSH distributes to the C3 stream rather than to the C4 stream.

Figure 5

EtSH: Figure 6 shows the distribution and recovery of EtSH in the C3, C4, and C5 streams. Unexpectedly, the majority of the EtSH ends up in the C4 stream rather than C5 as would be expected in Figure 2.

Figure 6

CS2: Figure 7 shows the distribution and recovery of CS2 in the C4, and C5 streams. Contrary to the pure CS2 behavior (Figure 2), the majority of the CS2 ends up in C4 stream.

Figure 7

iC3SH: Figure 8 shows the distribution and recovery of iC3SH in the C4, C5 and C6+. As expected, iC3SH ends up in C5 and C6+ streams.

Figure 8

iC4SH: Figure 9 shows recovery of iC4SH in the C6+ stream. As expected, all of the iC4SH ends up in the C6+ stream.

Figure 9

Conclusions:

The calculation results presented and discussed here are specific to the liquid fractionation plant studied here, but there are some general conclusions that can be drawn from this study.

The results indicate that the highest concentration of ethyl mercaptan (EtSH) and carbon disulfide (CS2) are present in the C4 product (stream 20) and C5 Product (stream 23), respectively. The highest concentration of methyl mercaptan (MeSH) is present in the C3 product (stream 15).

The binary interaction parameters used in the EOS play an important role in the VLE behavior of the system under study, and affect the distribution of the sulfur-containing compounds present in the feed. Use of improper or incorrect binary interaction parameters may generate erroneous results. Care must be taken to use correct values of binary interaction parameters. In this study, the HYSYS library values of the binary interaction parameters were used.

Some of the sulfur-containing compounds (i.e. MeSH, EtSH, and CS2) were not distributed among the hydrocarbon products in the same the way one would expect from their volatilities and concentrations. This may be explained by the conclusion reported by Harryman and Smith who wrote “iC3SH is formed during fractionation within the depropanizer and the deethanizer”.  This should be a good reason to perform laboratory tests and detailed thermodynamic tray calculations to determine process flow rates and composition. Detailed process analysis should always be made to justify and prove correct decisions as to selection of process flow schemes.

To learn more about similar cases and how to minimize operational problems, we suggest attending the John M. Campbell courses; G4 (Gas Conditioning and Processing)G5 (Gas Conditioning and Processing-Special) and G6 (Gas Treating and Sulfur Recovery).

John M. Campbell Consulting (JMCC) offers consulting expertise on this subject and many others. For more information about the services JMCC provides, visit our website at www.jmcampbellconsulting.com, or email your consulting needs to consulting@jmcampbell.com.

By: Dr. Mahmood Moshfeghian

Reference:

  1. Maddox, R. N. and L. Lilly, “Gas Conditioning and Processing, Computer Applications for Production/Processing Facilities,” John M. Campbell and Company, Norman, Oklahoma, 1995.
  2. Maddox, R. N. and D. J. Morgan, “Gas Conditioning and Processing, Gas Treating and Sulfur Recovery Vol. 4,” John M. Campbell and Company, Norman, Oklahoma, 2006.
  3. Harryman, J.M. and B. Smith, “Sulfur Compounds Distribution in NGL’s; Plant Test Data – GPA Section A Committee, Plant design,“ Proceedings 73rd GPA Annual Convention, New Orleans, Louisiana, March, 1994.
  4. Harryman, J.M. and B. Smith, “Update on Sulfur Compounds Distribution in NGL’s; Plant Test Data – GPA Section A Committee, Plant design,“ Proceedings 75th GPA Annual Convention, Denver, Colorado, March, 1996.
  5. Likins, W. and M. Hix, “Sulfur Distribution Prediction with Commercial Simulators,” the 46th Annual Laurance Reid Gas Conditioning Conference Norman, OK 3 – 6 March, 1996.
  6. Al-Sayegh, A.R., Moshfeghian, M.  Abbszadeh, M.R., Johannes, A. H. and R. N. Maddox, “Computer simulation accurately  determines volatile sulfur compounds,” Oil and Gas J., Oct 21, 2002.
  7. ASPENone, Engineering Suite, HYSYS Version 7.0, Aspen Technology, Inc., Cambridge, Massachusetts U.S.A., 2009.
  8. Peng, D.,Y. and D. B. Robinson, Ind. Eng. Chem. Fundam. 15, 59-64, 1976.

6 responses to “Distribution of Sulfur-Containing Compounds in NGL Products”

  1. website says:

    Fantastic website you have here but I was curious about if
    you knew of any discussion boards that cover the same topics discussed in this article?
    I’d really like to be a part of group where I can get feed-back from other experienced people that share the same interest.
    If you have any suggestions, please let me know.

    Appreciate it!

  2. Its like you read my mind! You appear to know so much about this, like
    you wrote the book in it or something. I think that you
    could do with a few pics to drive the message home a little bit, but instead of that, this
    is magnificent blog. An excellent read. I’ll certainly
    be back.

  3. Antje says:

    Dear Dr. MoshfeghianSalamI am a process eenengir and I come across your fantastic article in John Campbell website, and I really enjoy it. It would be a great honor for me to be in touch and consult with you on different cases.Best regardsReza Panahi

  4. That’s the best answer by far! Thanks for contributing.

  5. Just wanna input on few general things, The website design is perfect, the content is rattling good : D.

  6. zied ben hle says:

    please, i need a hysys tutoriol for this unit

Variation of properties in the dense phase region; Part 2 – Natural Gas

In the last tip of the month (TOTM) we described the dense phase of a pure compound and how it impacted processes. We illustrated how thermophysical properties change in the dense phase as well as in the neighboring phases. The application of dense phase in the oil and gas industry was discussed briefly. In this TOTM, we will discuss the dense phase behavior of multi-component systems, like natural gases.

When a natural gas, is compressed above the cricondenbar in the region between critical temperature andcricondentherm, it becomes a dense, highly compressible fluid that demonstrates properties of both liquid and gas. Figure 1 presents different regions of the phase envelope for a typical natural gas mixture with the composition shown in Table 1.

Table 1. Composition of the natural gas used in this study

Table 1

For simplicity and convenience, we define the dense phase to be within critical temperature and cricondentherm if the pressure is above the cricondenbar. In practice, there is no clear line (i.e. critical temperature) dividing dense phase from liquid phase or other single line (i.e. cricondentherm) dividing the dense phase from the gas phase. Both the left bound (critical temperature) and the right bound (cricondentherm) should be replaced by a transition region. There is a gradual transition from the gas phase to the dense phase and another gradual transition from the dense phase to the liquid phase. The dense phase is often referred to as a “dense fluid” to distinguish it from normal gas and liquid (see Figure 1). Dense phase is a fourth (Solid, Liquid, Gas, Dense) phase that cannot be described by the senses. The word “fluid” refers to anything that will flow and applies equally well to gas and liquid. The dense phase has a viscosity similar to that of a gas, but a density closer to that of a liquid. Because of its unique properties, dense phase has become attractive for transportation of natural gas.

Figure 1

Pipelines have been built to transport natural gas in the dense phase region due to its higher density. This also provides an added benefit of no liquids formation in the pipeline, reducing pigging and pressure drop which results in lower OPEX. The higher density at higher pressure in the dense phase allows transporting more mass per unit volume, resulting in higher CAPEX. However, the OPEX reduction usually offsets the CAPEX increment.  As shown in the following sections, the value of the dense phase viscosity is very similar to gas phase viscosity. The dense phase density is closer to the liquid phase density.
In the next section we will illustrate the variation of thermophysical properties in the dense phase and its neighboring phases. Natural gas properties have been calculated with HYSYS software for a series of temperatures and pressures. Table 2 presents, the pressures and temperatures and their paths used in this study.
The calculated thermophysical properties are plotted as a function of pressure and temperature in Figures 2 to 9. The thermophysical property is shown on the left-hand side y-axis, temperature on the x-axis and pressure on the right-hand side y-axis.

Table 2. Pressure-Temperature combination and the paths chosen for natural gas

Table 2

Density:
Figure 2 presents the variation of density in different phases as a function of pressure and temperature. In the isobaric subcooling path of AB, liquid density increases sharply. However, in the isothermal compression of BC path, a small increase of density is observed. In the isobaric CD path, compressed liquid density decreases gradually as temperature is increased well into the dense phase region. However, as the temperature increases further in the dense phase, density reduction is accelerated. Reduction of density is further accelerated during isothermal expansion of DE. Isobaric cooling of gas along EF path corresponds with a sharp increase in density. It can be noted the values of dense phase density are close to the liquid phase density in some areas of the dense phase region, and is overall significantly higher than the gas phase densities.

Figure 4

Viscosity:
Figure 3 presents the variation of viscosity in different phases as a function of pressure and temperature. In the isobaric subcooling path of AB, liquid viscosity increases sharply. However, in the isothermal compression of BC path, a very small change of viscosity is observed. In the isobaric CD path, compressed liquid viscosity decreases linearly and sharply as temperature is increased well into the dense phase region. As the temperature increases further in the dense phase, viscosity reduction becomes gradual and approaches the gas phase values. Reduction of viscosity is quite small during isothermal expansion of DE. Isobaric cooling of gas along EF path up to the dew point temperature corresponds with no appreciable change in viscosity but increases noticeably in the two phase region. For the sake of completing the graph, the two phase viscosity was estimated by: Equationwhere (V/F) and (L/F) are vapor and liquid mole fractions, respectively.

Figure 3

Compressibility Factor:
In general, the compressibility factor, Z, calculated by an equation of state is not accurate for the liquid phase. Therefore, Figure 4 which presents compressibility factor as a function of pressure and temperature should be considered for qualitative study only. In the isobaric subcooling path of AB, Z decreases. However, in the isothermal compression of BC path, Z increases drastically. In the isobaric CD path, Z remains almost constant in the compressed liquid region but increases gradually as temperature is increased well into the dense phase region. As the temperature increases further in the dense phase, the increase in Z is accelerated. The increase in Z is further accelerated during isothermal expansion of DE. Isobaric cooling of gas along EF path corresponds with a gradual decrease in Z. In the two-phase region, Z is not applicable and its value is not plotted.

Figure 4

Figure 5 shows that in the liquid phase, surface tension is a strong function of temperature but independent of pressure. In the gas phase, surface tension is not applicable and its value is zero. In the two-phase region, it reached a maximum value.

Figure 5

Heat Capacity:
Generally, heat capacity is applicable in a single phase region and should not be used when there is a phase change. Figure 6 presents the variation of heat capacity in different phases as a function of pressure and temperature. In the isobaric subcooling path of AB, liquid heat capacity decreases. In the isothermal compression of BC path, a small increase of heat capacity is observed. In the isobaric CD path, compressed liquid heat capacity increases sharply as temperature is increased but starts to decrease in the dense phase region. As the temperature increases further in the dense phase, heat capacity decreases. This is strange behavior and surprisingly high values are calculated. Similar results were obtained for pure methane in the previous TOTM. Increase of heat capacity is further noticed during isothermal expansion of DE. Isobaric cooling of gas along EF path corresponds with a gradual increase in heat capacity up to a maximum point and then starts to decrease in the two phase region.

Figure 6

Thermal Conductivity:
Figure 7 presents the variation of thermal conductivity in different phases as a function of pressure and temperature. In the isobaric subcooling path of AB, liquid thermal conductivity increases sharply. In the isothermal compression of BC path, no change is observed. In the isobaric CD path, compressed liquid thermal conductivity decreases sharply as temperature is increased well into the dense phase region. However, as the temperature increases further in the dense phase, thermal conductivity reduction is gradual. Reduction of thermal conductivity is further noticed during isothermal expansion of DE. Isobaric cooling of gas along EF path corresponds with a small decrease in thermal conductivity and goes up in the two-phase region. The two-phase thermal conductivity was calculated in the same manner as described in the viscosity section.

Figure 7

Enthalpy and Entropy:
Figures 8 and 9 present the variation of enthalpy and entropy in different phases as a function of pressure and temperature. As shown in these figures, their qualitative variations are similar. In the isobaric subcooling path of AB, liquid enthalpy and entropy decrease. In the isothermal compression of BC path, no change is observed. During the isobaric CD path, compressed liquid enthalpy and entropy values increase gradually as temperature is increased well into the dense phase region. The increase in enthalpy and entropy is further noticed during isothermal expansion of DE. Isobaric cooling of vapor along EF path corresponds with a decrease in enthalpy and entropy.

Figure 8 and 9

Conclusions:
Dense phase behavior is unique and has special features. The thermophysical properties in this phase may vary abnormally. Care should be taken when equations of state are used to predict thermophysical properties in dense phase. Evaluation of equations of state should be performed in advance to assure their accuracy in this region. Many simulators offer the option to use liquid-based algorithms (e.g. COSTALD) for this region. It is also recommended not to use heat capacity in the two-phase (gas-liquid) and in the dense phase. In these regions, enthalpy should be used for heat duty and energy balance calculations.
There is a gradual change of phase transition from gas-to-dense and dense-to-liquid phases or vice versa. Dense phase is a highly compressible fluid that demonstrates properties of both liquid and gas. The dense phase has a viscosity similar to that of a gas, but a density closer to that of a liquid. This is a favorable condition for transporting natural gas in dense phase.
To learn more about similar cases and how to minimize operational problems, we suggest attending our G-40 (Process/Facility Fundamentals)G-4 (Gas Conditioning and Processing)PF-81 (CO2 Surface Facilities), and PF-4 (Oil Production and Processing Facilities) courses.

John M. Campbell Consulting (JMCC) offers consulting expertise on this subject and many others. For more information about the services JMCC provides, visit our website at www.jmcampbellconsulting.com, or email your consulting needs to consulting@jmcampbell.com.

By: Dr. Mahmood Moshfeghian

Reference:

  1. ASPENone, Engineering Suite, HYSYS Version 2006, Aspen Technology, Inc., Cambridge, Massachusetts U.S.A., 2006.

3 responses to “Variation of properties in the dense phase region; Part 2 – Natural Gas”

  1. Hussein Ismail says:

    Dr. Mohamed,
    Asslam Alyk
    I am very busy with super-critical process design for a new gas plant.
    Have you come across any process design above cricondenbar

    My regards

  2. […] and liquid (see Figure 1 in December 2009 Tip Of The Mont (TOTM) [1] for carbon dioxide and in January 2010 TOTM [2] for a typical natural gas). Dense phase is a fourth (Solid, Liquid, Gas, Dense) phase that […]

  3. ahmed says:

    you are kindly requested to explain to me what are the possible implications of changing the gas flow from Dense Phase to Liquid Phase due to that the arrival pressure is higher than the Cri-condenbar but not between Critical Point and the Cri-condentherm.

    • The dense phase region shown on these diagrams are ideal. It is not that easy to differentiate between gas phase to dense phase and from dense phase to liquid phase. Practically, the phase transitions between phases above cricondenbar are gradual. By lowering the temperature above the cricondenbar, one would expect to reach eventually a liquid phase.

Variation of properties in the dense phase region; Part 1 – Pure Compounds

In this tip of the month (TOTM) we will describe the dense phase of a pure compound, what it is, and how it impacts processes. We will illustrate how thermophysical properties change in the dense phase as well as in the neighboring phases. The application of dense phase in the oil and gas industry will be discussed briefly. In next month TOTM, we will discuss the dense phase behavior of multi-component systems.

When a pure compound, in gaseous or liquid state, is heated and compressed above the critical temperature and pressure, it becomes a dense, highly compressible fluid that demonstrates properties of both liquid and gas. For a pure compound, above critical pressure and critical temperature, the system is oftentimes referred to as a “dense fluid” or “super critical fluid” to distinguish it from normal vapor and liquid (see Figure 1 for carbon dioxide). Dense phase is a fourth (Solid, Liquid, Gas, Dense) phase that cannot be described by the senses. The word “fluid” refers to anything that will flow and applies equally well to gas and liquid. Pure compounds in the dense phase or supercritical fluid state normally have better dissolving ability than do the same substances in the liquid state. The dense phase has a viscosity similar to that of a gas, but a density closer to that of a liquid. Because of its unique properties, dense phase has become attractive for transportation of natural gas, enhanced oil recovery, food processing and pharmaceutical processing products.

The low viscosity of dense phase, super critical carbon dioxide (compared with familiar liquid solvents), makes it attractive for enhanced oil recovery (EOR) since it can penetrate through porous media (reservoir formation). As carbon dioxide dissolves in oil, it reduces viscosity and oil-water interfacial tension, swells the oil and can provide highly efficient displacement if miscibility is achieved. Additionally, substances disperse throughout the dense phase rapidly, due to high diffusion coefficients. Carbon dioxide is of particular interest in dense-fluid technology because it is inexpensive, non-flammable, non-toxic, and odorless. Pipelines have been built to transport natural gas in the dense phase region due to its higher density, and this also provides the added benefit of no liquids formation in the pipeline.

In the following section we will illustrate the variation of thermophysical properties in the dense phase and its neighboring phases. Methane properties have been calculated with HYSYS software for a series of temperatures and pressures. Table 1 presents, the pressures and temperatures and their paths used in this study.

Figure 1

The calculated thermophysical properties are plotted as a function of pressure and temperature in Figures 2 to 9. The thermophysical property is shown on the left-hand side y-axis, temperature on the x-axis and pressure on the right-hand side y-axis.

Table 1. Pressure-Temperature combination and the paths chosen for methane

Table 1

Density:

Figure 2 presents the variation of density in different phases as a function of pressure and temperature. In the isobaric subcooling path of AB, liquid density increases gradually. However, in the isothermal compression of BC path, a small increase of density is observed. In the isobaric CD path, compressed liquid density decreases gradually as temperature is increased well into the dense phase region. However, as the temperature increases further in the dense phase, density reduction is accelerated. Reduction of density is further accelerated during isothermal expansion of DE. Isobaric cooling of vapor along EF path corresponds with a gradual increase in density. It can be noted the values of dense phase density are close to the liquid phase density in some areas of the dense phase region, and is overall significantly higher than the vapor phase densities.

Figure 2

Viscosity:

Figure 3 presents the variation of viscosity in different phases as a function of pressure and temperature. In the isobaric subcooling path of AB, liquid viscosity increases rapidly. However, in the isothermal compression of BC path, a very small change of viscosity is observed. In the isobaric CD path, compressed liquid viscosity decreases linearly and sharply as temperature is increased well into the dense phase region. As the temperature increases further in the dense phase, viscosity reduction becomes gradual and approaches the gas phase values. Reduction of viscosity is quite small during isothermal expansion of DE. Isobaric cooling of vapor along EF path corresponds with no appreciable change in viscosity.

Figure 3

Compressibility Factor:

In general, the compressibility factor Z, calculated by an equation of state is not accurate for the liquid phase. Therefore, Figure 4 which presents compressibility factor as a function of pressure and temperature should be considered for qualitative study only. In the isobaric subcooling path of AB, Z remains almost constant. However, in the isothermal compression of BC path, Z increases drastically. In the isobaric CD path, Z increases gradually as temperature is increased well into the dense phase region. As the temperature increases further in the dense phase, the increase in Z is accelerated. The increase in Z is further accelerated during isothermal expansion of DE. Isobaric cooling of vapor along FF path corresponds with a gradual decrease in Z.

Figure 4

Surface Tension:

Figure 5 shows that in the liquid phase, surface tension is a strong function of temperature but independent of pressure. Above the critical temperature, surface tension is not applicable and its value is zero.

Heat Capacity:

Generally, heat capacity is applicable in a single phase region and should not be used when there is a phase change. Figure 6 presents the variation of density in different phases as a function of pressure and temperature. In the isobaric subcooling path of AB, liquid heat capacity decreases. In the isothermal compression of BC path, a small decrease of heat capacity is observed. In the isobaric CD path, compressed liquid heat capacity increases gradually as temperature is increased well into the dense phase region. As the temperature increases further in the dense phase, heat capacity reaches a maximum value and then starts to decrease. This is strange behavior and surprisingly high values are calculated. Similar results were obtained using ProMax software. Reduction of heat capacity is further noticed during isothermal expansion of DE. Isobaric cooling of vapor along EF path corresponds with a gradual increase in heat capacity.

Thermal Conductivity:

Figure 7 presents the variation of thermal conductivity in different phases as a function of pressure and temperature. In the isobaric subcooling path of AB, liquid thermal conductivity increases. In the isothermal compression of BC path, no change is observed. In the isobaric CD path, compressed liquid thermal conductivity decreases gradually as temperature is increased well into the dense phase region. However, as the temperature increases further in the dense phase, thermal conductivity reduction is accelerated. Reduction of thermal conductivity is further noticed during isothermal expansion of DE. Isobaric cooling of vapor along EF path corresponds with a small decrease in thermal conductivity.

Figure 5

Figure 6

Enthalpy and Entropy:

Figures 8 and 9 present the variation of enthalpy and entropy in different phases as a function of pressure and temperature. As shown in these figures, their qualitative variations are similar. In the isobaric subcooling path of AB, liquid enthalpy and entropy decrease. In the isothermal compression of BC path, no change is observed. During the isobaric CD path, compressed liquid enthalpy and entropy values increase gradually as temperature is increased well into the dense phase region. However, as the temperature increases further in the dense phase, the enthalpy and entropy increase becomes larger. The increase in enthalpy and entropy is further noticed during isothermal expansion of DE. Isobaric cooling of vapor along EF path corresponds with a decrease in enthalpy and entropy.

Figure 7

Conclusions:

Dense phase behavior is unique and has special features. The thermophysical properties in this phase may vary abnormally. Care should be taken when equations of state are used to predict thermophysical properties in dense phase. Evaluation of equations of state should be performed in advance to assure their accuracy in this region. Many simulators offer the option to use liquid-based algorithms (e.g. COSTALD) for this region.
As shown in Figure 1, there is a gradual change of phase transition from gas-to-dense and dense-to-liquid phases or vice versa. Dense phase is a highly compressible fluid that demonstrates properties of both liquid and gas. The dense phase has a viscosity similar to that of a gas, but a density closer to that of a liquid. This is a favorable condition for transporting natural gas in dense phase as well as carbon dioxide injection into crude oil reservoir for enhanced oil recovery.

To learn more about similar cases and how to minimize operational problems, we suggest attending our G40 (Process/Facility Fundamentals)G4 (Gas Conditioning and Processing)PF81 (CO2 Surface Facilities), and PF4 (Oil Production and Processing Facilities) courses.

John M. Campbell Consulting (JMCC) offers consulting expertise on this subject and many others. For more information about the services JMCC provides, visit our website at www.jmcampbellconsulting.com, or email your consulting needs to consulting@jmcampbell.com.

By: Mark Bothamley and Mahmood Moshfeghian

Reference:

  1. ASPENone, Engineering Suite, HYSYS Version 2006, Aspen Technology, Inc., Cambridge, Massachusetts U.S.A., 2006.

Figure 8

Figure 9

7 responses to “Variation of properties in the dense phase region; Part 1 – Pure Compounds”

  1. […] fluid” to distinguish it from normal vapor and liquid (see Figure 1 for carbon dioxide in December 2009 TOTM [1]). Dense phase is a fourth (Solid, Liquid, Gas, Dense) phase that cannot be described by the […]

  2. […] fluid” to distinguish it from normal vapor and liquid (see Figure 1 for carbon dioxide in December 2009 TOTM […]

  3. […] Para un compuesto puro, por encima de la presión y temperatura crítica, se le refiere al sistema con frecuencia como uno de “fase densa”, o fluido super – crítico para diferenciarlo de un vapor o líquido normal (véase la Figura 1 para el dióxido de carbono en el PDM de Diciembre 2009 [1]). […]

  4. […] fluid” to distinguish it from normal vapor and liquid (see Figure 1 for carbon dioxide in December 2009 TOTM […]

  5. search tools says:

    Submit Comment

  6. […] or “super critical fluid” to distinguish it from normal vapor and liquid (see Figure 1 in December 2009 Tip Of The Mont (TOTM) [1] for carbon dioxide and in January 2010 TOTM [2] for a typical natural gas). Dense phase is a […]

  7. […] fluid” to distinguish it from normal vapor and liquid (see Figure 1 for carbon dioxide in December 2009 TOTM […]

  8. Buenos días me he leído tu post y me apetecía agradecerte que hayas gastado tu tiempo en recopilar toda esta información tan necesaria para los que nos encontramos perdiendo peso. gracias por tu articulo!! Y un saludo!!

  9. Good post. I am a regular visitor of your web site and appreciate you taking the time to maintain the nice site. I will be a regular visitor for a long time.

  10. Muhammad Shehreyar Khan says:

    In first & 2nd diagrams AB & CD are referred as isobaric processes although pressure seems to change from approx 4.4 MPa(g) to 5.4 MPa(g) in case of AB (as indicated by black line).

  11. Silvia Denti says:

    Letto, ottime informazioni buona giornata

  12. Loving the information on this web site, you have done outstanding job on the blog posts.

  13. I dugg some of you post as I thought they were invaluable extremely helpful

Three Simple Things to Improve Process Safety Management

In this Tip of the Month, we look at how to deal with some of the challenges of managing process safety.  This TOTM is an excerpt of a paper presented by JMC Instructor/Consultant, Clyde Young at the 2008 Mary K. O’Connor Process Safety Symposium.  This TOTM continues where the February 2009, TOTM left off.

Processes are designed to run in a “normal” mode.  No process is really stagnant and throughout the life cycle of a process, changes will be made.  When defining “normal”, some tolerance should be built in to allow a range of operating conditions for operators to work within.  When changes to operating parameters, or the equipment in the process are required, these must be evaluated and approved. Any effective process safety management system will contain an element to deal with Management of Change (MOC).  Experience conducting training, audits and process hazard analysis studies indicate that identifying what changes require evaluation using the MOC process can be confusing at times.  Some organizations only evaluate technical changes to the process and equipment and ignore or forget about managing changes to the PSM system or personnel changes within the organization.

Insuring that PHAs are consistent with the process through the revalidation process is less time consuming and more likely to yield effective results if the facility’s MOC program is rigorously followed.  If this cannot be assured, then the only choice may be a complete redo of the PHAs.  This could be very expensive and resource intensive.

To alleviate confusion and especially to insure that all personnel within an organization understand and will follow the MOC program requires practice.  As more MOCs are developed and approved, all personnel become more competent at evaluating change and meeting the requirements of the program.  Ever since the US Occupational Safety and Health Administration (OSHA) implemented the PSM standard in 1992, one of the hottest debate topics witnessed in plant offices is about replacement in kind.  OSHA and CCPS define a replacement in kind as meeting the design specification of the original.  This is a workable definition, but can cause some confusion when personnel are not well versed in PSM and risk management.

The second simple thing which can be done to improve process safety management systems is to do away with the concept of replacement in kind.  Again, this does not have to be and probably can’t be accomplished throughout an organization; this can certainly be implemented at the process and plant level for a specified period of time.  The purpose of this change would be to end the debates and more importantly allow personnel an opportunity to practice and become competent at all the issues associated with performing changes.

A real life example illustrates this:

A Waukesha 7042 engine is scheduled for overhaul.  Three options are considered:

  • overhaul in place by company personnel,
  • overhaul in place with contract personnel
  • removal of engine and ship to contractor for overhaul.

The most economical choice was found to be, swap the engine with another 7042 engine.  The only difference is the serial number.  This was determined to be a replacement in kind, and by definition it is.  However, the older 7042 engine was “grandfathered” under the facility’s air discharge permit from the environmental regulatory body.  As soon as a new engine, with a different serial number was installed, the “grandfathering’ of the older engine was invalid and a new air permit had to be issued.  To meet the requirements of the new permit, air/fuel ratio controllers and catalytic converters were required.  This change cost the company approximately $70,000 above the highest priced option that was analyzed.   This change also increased the workload on maintenance and operations staff, which could affect other areas of operations.

During audits, there have been several instances where plant personnel try to stretch the replacement in kind exemption so that changes to the process are not evaluated with the MOC process.  The most frequent reasoning for this is that the MOC process is too cumbersome and takes too long.  In the end, the MOC process is being bypassed and potential hazards may not be addressed appropriately.

The MOC process to, evaluate personnel changes, is used by some organizations, but generally it occurs for changes at the supervisory level.  But consider that no two people are the same.  Both have different skill sets and it is important to dig a bit deeper into the “design specification of the original” to determine what the real impact of personnel changes might be.  Especially consider the reassignment or replacement of operations and maintenance personnel.  Identifying gaps in their technical competencies should be an important part of the MOC evaluation.  The evaluation can be a powerful tool for performance management and identification of training opportunities for development.

In the end, doing away with the replacement in kind exemption within a facility’s MOC process can increase the process safety competencies of all personnel.  Process safety competency is one of the elements of the CCPS Risk Based Safety Management guidelines.  Increased competency leads to a change in the culture and hopefully a safer process.  Within the world of adult learning, it is recognized that learners must be given the opportunity to apply lessons to the job or the training may be lost.  Considerable time and effort may be spent providing training to personnel on the procedures for managing change, but how often are they given the opportunity to put this training into practice within the working environment?

The final simple thing will be presented in a future tip of the month.  If you would like a copy of the paper that was presented, please contact John M. Campbell & Co. and request a copy.

To learn more about managing process safety systems, we suggest attending our PetroSkills HSE course, HS 45- Risk Based Process Safety Management or schedule a session of our two day Process Safety Case Study for Operations and Maintenance – OT 21, which can be found in our catalog.  To enhance process safety engineering skills we suggest any of the JMC foundation courses and watch for an announcement scheduling sessions of our newly developed,  PS 4 – Process Safety Engineering course.

By: Clyde Young
Instructor/Consultant

1 response to “Three Simple Things to Improve Process Safety Management”

  1. Robin Mock says:

    Great article. I am new to the PSM process and am attempting to develop a list of questions for the front line supervisor when determining if a MOC is required. I found you information a great help.

Considering the effect of crude oil viscosity on pumping requirements

In the August 2009 Tip of the Month (TOTM), it was shown that pumping power requirement varies as the crude oil °API changes. Increasing °API or line average temperature reduces the crude oil viscosity. The viscosity reduction caused higher Reynolds number, lower friction factor and in effect lowered pumping power requirements. Since the objective of the August 2009 TOTM was to study the effect °API and the line average temperature have on the pumping power requirement, the effect of crude oil viscosity on pump performance was ignored and in the course of calculation a constant pump efficiency of  =0.75 was used for all cases. In this TOTM, we will consider the crude oil viscosity effect on a selected pump performance. The Hydraulic Institute Standards [1] procedures and the guideline presented in the August 2006 TOTM written by Honeywell were applied to correct the pump efficiency.

As in the August 2009 TOTM, we will study crude oil °API and the pipeline average temperature and how these effect the pumping requirement. For a case study, we will consider a 160.9 km (100 miles) pipeline with an outside diameter of 406.4 mm (16 in) carrying crude oil with a flow rate of 0.313 m3/s or 1,126 m3/h (170,000 bbl/day or 4958 GPM). The pipeline design pressure is 8.963 MPa (1300 psia) with a maximum operating pressure of 8.067 MPa (1170 psia). The wall thickness was estimated to be 6.12 mm (0.24 in). The wall roughness is 51 microns (0.002 in) or a relative roughness (e/D) of 0.00013. The procedures outlined in the March 2009 TOTM were used to calculate the line pressure drop due to friction. Then corrected pumping efficiency was used to calculate the required pumping power. Since the objective was to study the effect °API and the line average temperature have on the pumping power requirement, we will ignore elevation change. The change in pumping power requirements due to changes in crude oil °API and line average temperature for this case study will be demonstrated.

Viscosity Effect on Centrifugal Pump Performance
There are several papers investigating and presenting procedures for correcting centrifugal pump curves [2-3].  According to Turzo et al. [2], three models are available for correcting performance curves: Hydraulic Institute, Stepanoff, and Paciga.  Turzo et al. [2] also presented a computer applications for correcting pump curves for viscosity effect. In this review, the Hydraulic Institute [1], HI, procedure was applied and is described briefly here.

HI uses a performance factor, called Parameter B which includes terms for viscosity, speed, flow rate and total head. The method uses a new basis for determining the correction factors CH, CQ, and C.  The basic equation for Parameter B is given as Equation 1.

Equation 1

B = Performance factor
K = 16.5 for SI units
= 26.5 for USCS (FPS)
Nuvis = Viscous fluid Kinematic viscosity – cSt
HBEP-W = Water head per stage at BEP – m (ft)
QBEP-W = Water flow rate at BEP – m3/h (gpm)
N = Pump shaft speed – rpm

Correction factors are applied to capacity (CQ), head (CH), and efficiency (CNu). Calculation of these Correction Factors is dependent on the calculated value of Parameter B. For the cases considered in this study, the B values were less than 1; therefore, based on the HI guideline, the correction factors for head and capacity were set equal to 1 and the correction factor for efficiency, CNu, was calculated by Equation 2.

Equation 2

Nu BEP-W = Pump efficiency at BEP
Vw = Water kinematic viscosity – cSt

Figures 1 and 2 present the water-based pump curves used in this study. For computer calculations, these two curves were fitted to polynomials of degrees 3 and 2 for head vs capacity and efficiency vs capacity, respectively.

Equations

In Equations 3 and 4, H is in m (ft) and Q is in m3/h (GPM). For this pump:

HBEP-W=323m=1060ft,       QBEP-W =1726 m3/h= 7600 GPM, N=1780 rpm, and NuBEP-W =83.4.

Figure 1

Case Study 1: Effect of Line Average Temperature (Seasonal Variation)
To study the effect of the line average temperature on the pumping power requirement, an in house computer program called OP&P (Oil Production and Processing) was used to perform the calculations outlined in the March 2009 TOTM. For a 35 °API crude oil in the pipeline described the required pumping power was calculated for line average temperature ranging 21.1 to 37.8 °C (70 to 100 °F). For each case, the parameter B was calculated by Equation 1 and since its value was less than 1, the efficiency correction factor was calculated by Equation 2. Then, the pump efficiency calculated by Equation 4 was multiplied by the correction factor for the subsequent calculations. The corrected efficiency ranged from 0.70 to 0.72. The required pumping power was compared with an arbitrary base case (85 °F or 29.4 °C and constant Nu = 0.75) and the percentage change in the pumping power requirement was calculated. Figure 3 presents the percent change in power requirement as a function of line average temperature. There is about 5% change (for constant Nu=0.75) and more than 8% change (for corrected efficiency) in the pumping power requirement for the temperature range considered.

Figure 2

Note that as the line average temperature increases the power requirement decreases. This can be explained by referring to Figure 4 in which the oil viscosity decreases as the temperature increases. Lower viscosity results in higher Reynolds (i.e. Reynolds number Equation which is the ratio of inertia force to viscous force); therefore, the friction factor decreases (refer to the Moody friction factor diagram in the March 2009 TOTM).

Figure 3

Case Study 2: Effect of Variation of Crude Oil °API
In this case, the effect of crude oil °API on the total pump power requirement for three different line average temperatures was studied. For each line average temperature, the crude oil °API was varied from 30 to 40 and the total pumping power requirement was calculated and compared to the base case (35 °API and average line temperature of 29.4°C=85°F).

For each case the percent change in total power requirement was calculated and is presented in Figure 5. As shown, when °API increases the total power requirement decreases. This also can be explained by referring to Figure 4 in which the crude oil viscosity decreases as ° API increases. The effect of viscosity is more pronounced at lower line average temperature (i.e. 21.1 °C or 70°F). Figure 5 also indicates that there is about 30 % change in total power requirement as °API varies from 30 to 40 °API. This is a significant variation and suggests that it should be considered during design of crude oil pipelines.

Discussion and Conclusions
The analysis of Figures 3 and 5 indicates that for the oil pipeline, the pumping power requirement varies as the crude oil °API changes. Increasing °API or line average temperature reduces the crude oil viscosity (see Figure 4). The reduction of viscosity results in higher a Reynolds number, lower friction factor and in effect lowers pumping power requirements.

For the cases studied in this TOTM, the effect of crude oil viscosity on the performance of pump was considered. It was found that no correction was required for the capacity and head but a correction factor in the range of 0.95 to 0.98 was required to adjust the pump efficiency for crude oil applications.

Figure 4

A sound pipeline design should consider expected variations in crude oil °API and the line average temperature. In addition, the pump performance curves should be corrected for the effect of viscosity.

To learn more about similar cases and how to minimize operational problems, we suggest attending our ME44 (Overview of Pumps and Compressors in Oil and Gas Facilities)ME46 (Compressor Systems – Mechanical Design and Specification)PL4 (Fundamental Pipeline Engineering)G40 (Process/Facility Fundamentals)G4 (Gas Conditioning and Processing), and PF4 (Oil Production and Processing Facilities) courses.

By: Dr. Mahmood Moshfeghian

Figure 5

References:

  • ANSI HI 9.6.7-2004, “Effects of Liquid Viscosity on Rotodynamic (Centrifugal and Vertical) Pump Performance”, 2004.
  • Turzo, Z.; Takacs, G. and Zsuga, J., “Equations Correct Centrifugal Pump Curves for Viscosity,” Oil & Gas J., pp. 57-61, May 2000.
  • Karassik, I.J., “Centrifugal Pumps and System Hydraulics,” Chem. Engr. J., pp.84-106, Oct. 4, 1982

20 responses to “Considering the effect of crude oil viscosity on pumping requirements”

  1. P K Saha says:

    Effect on pump power understandable. Would like to know what crude oil temperature should be assumed when ambient temperature is sub-zero say minus 10-15 degree C. What is viscosity at (-) 12 degree C for say API 32.5 crude oil? Will any heating be required to maintain flowability and reduce power requirement especially if friction loss is not a substantial percentage of total dynamic head for the pump?

  2. james waghorn says:

    i hope you like my case study

  3. Christiano Ronaldo says:

    YaYa YaYa YaYa Kolo Kolo YaYa

  4. alejandro gonzalez says:

    james will you marry me

  5. jess grayston says:

    every body knows me and james will end up together alex

  6. P K Saha says:

    guys I’m a gay vicar i now pronounce you husband and wife

  7. pat gibson says:

    I’m a gay vicar too

  8. patrick gibson says:

    p k do u want to meet up

  9. p k saha says:

    yeah sure

  10. Louis says:

    Spot on with this write-up, I truly feel this amazing site needs a lot more attention. I

  11. Isabel Marant Sneakers Isabel Marant Heels YNBQU Seguire le sue tracce.
    Se vedete tutte le scarpe con un arco in mezzo, o solo leggermente curvo, può essere archi bassi o piedi piatti..
    2014 Isabel Marant Isabel Marant Sneakers QWdVU Nonostante colpire,
    Nike è ancora difficile da monitorare. Reebok CEO Paul Fireman ha riconosciuto che più di
    analisti di Wall Street. 2014 Isabel Marant Isabel Marant Sneakers XiiSU Nessuno ha visto questa tendenza a venire,
    e ora la gente club, ristoranti, e le località balneari utilizzare stivali da neve a lavorare.

    Indipendentemente dalla possibile comparsa,
    ugg neve a buon mercato. Isabel Marant Heels Isabel Marant Boots vpjil Che cosa sono esattamente all’ingrosso borse del progettista ispirato?
    Contrariamente a quanto si pensa, borse del progettista ispirato non sono imitazioni di borse del progettista.
    Essi non sono falsi e non pretendono di essere la cosa reale.
    Isabel Marant Boots Isabel Marant Boots WJYWE E poi, la
    seconda si zip off di promesse, andare a combattere di nuovo una confezione da sei?
    Tale ipocrisia sfacciata. Comunque, abbiamo iniziato a bere subito.

    Isabel Marant Sandal Isabel Marant Sneakers CcOzj Anche per me
    venire qui per compilare un passaporto, cose come questo è successo nel
    1990. Tratta di soldi soldi, e la carta. Isabel Marant Sandal 2014 Isabel Marant goopm Quando lei ha
    sostenuto vissuto negli Stati Uniti, una dozzina di anni prima di Jackie Kennedy erano
    ancora regnava alla Casa Bianca. Guardò il naso a me con un cipiglio, ha sollevato la sua
    altezza ampio Anche gran tacco 4 pollici navy.

    Isabel Marant Sneakers Isabel Marant Boots TNvbZ Come l’unica donna
    bianca in furgone, quindi la mia presenza non è per
    motivi di curiosità. L’ho detto e mi sono tagliato un amico giornalista di un amico
    che non poteva venire.

  12. fantastic points altogether, you just received a new reader.
    What may you suggest in regards to your put up that you simply made some days
    ago? Any certain?

  13. find here says:

    I simply want to mention I’m new to blogging and truly loved this page. Very likely I’m likely to bookmark your site . You amazingly have outstanding article content. Thanks for sharing your website.

  14. Thanks designed for sharing such a good idea, post is nice, thats why i have read it entirely|

  15. Eloy Verhaag says:

    Merely wanna tell that this is very useful, Thanks for taking your time to write this.

  16. My spouse and i obtained this specific necklace around your neck as being a treat coming from the ally. That is one of the the majority of special gifts I have ever before obtained. This is behind this necklace around your neck is literally near along with precious to the cardiovascular whenever We wear it!

  17. Simply wish to say your article is as astounding. The clearness on your submit is simply nice and that i could assume you are an expert in this subject. Well along with your permission allow me to seize your feed to keep up to date with impending post. Thanks 1,000,000 and please keep up the enjoyable work.|

  18. At this time it seems like BlogEngine is the top blogging platform out there right now. (from what I’ve read) Is that what you’re using on your blog?

  19. Whats up are using WordPress for your site platform? I’m new to the blog world but I’m trying to get started and set up my own. Do you need any coding expertise to make your own blog? Any help would be really appreciated!

  20. Along with every thing that appears to be building inside this particular area, many of your viewpoints are actually somewhat refreshing. However, I appologize, but I can not subscribe to your whole suggestion, all be it radical none the less. It looks to everyone that your opinions are actually not completely rationalized and in simple fact you are generally yourself not really completely certain of your assertion. In any event I did take pleasure in reading through it.

How to Tune the EOS in your Process Simulation Software?

Process simulation computer programs are excellent tools for designing or evaluating gas processing plants, chemical plants, oil refineries or pipelines. In these simulation programs, most of the thermodynamic properties are calculated by an equation of state (EOS). The cubic equations of state can be regarded as the heart of these programs for generating the required properties. However, none of the equations of state is perfect and often some sort of tuning must be done prior to their applications. Some tuning is already done by researchers and has been embedded in the data base of these simulation programs. In dealing with non-standard or complex systems, the user should check the validity and accuracy of the selected thermodynamic package (i.e. EOS) in the simulation programs prior to attempting to run the desired simulation. Often the users find that tuning is required. This can be done by performing a series of vapor liquid equilibria (VLE) calculations such as dew point, bubble point or flash calculations and comparing the results with the field data or experimental data. If the accuracy is not within acceptable range, then the EOS should be tuned to improve its accuracy. The tuning can be done in several ways but the one most often used is adjusting/regressing the binary interaction parameters between binary pairs in the mixture using the experimental PVT or VLE data.

In this tip of the month (TOTM), we will demonstrate how the binary interaction parameters are tuned in a simulation program to improve the accuracy of a selected EOS. For this purpose, we will demonstrate how the accuracy of the bubble point pressure prediction of a ternary system of carbon dioxide, pentadecane, and hexadecane can be improved. We will use the Peng-Robinson (PR) [1] equation of state in ProMax [2] and the experimental VLE data published in the literature [3]. The same procedure can be used with any EOS in other simulation programs.

The PR EOS
The PR EOS [2] in terms of pressure (P), volume (v) and temperature (T) is defined as:
Equation 1
The values of the parameters a and b must be determined in a special way for mixtures. Any equation, or series of equations, used to obtain mixture parameters is called a combination rule or mixing rule. The calculation, regardless of its exact form, is based on the premise that the properties of a mixture are some kind of weighted average summation of the properties of the individual molecules comprising that mixture.
The mixing rules used in cubic equations of state (i.e., Peng-Robinson, Soave-Redlich-Kwong, and van der Waals) are:

Equation 2

Equation 3

Where: a and b = the interaction energy and molecular size parameters for the mixture
ai, bi = a and b parameters for component i in the mixture
xi = composition (mol fraction) for component i in the mixture
kij = binary interaction parameter
n = number of component in the mixture
R = Universal gas constant
The ai and bi for each component in the mixture are calculated in terms of critical temperature (Tci), pressure (Pci), and  acentric factor (?i) as presented in equations 4 and 5.

Equation 4

Equation 5

Once a and b have been determined, the equation of state computations proceed as though a and b were for a pure component. With cubic equations of state the mixing rules sum the properties based on binary pairs.

The binary interaction parameter, kij, has no theoretical basis. It is empirical and is used to overcome deficiencies in the corresponding states theory or the basic model (equation of state). Binary interaction parameters are regressed from experimental data for a specific model and should be applied in that model only. In addition, kij’s can be determined from regression of PVT data or VLE data. This will result in different kij’s for the same binary mixture.

The Effect of kij on Bubble Point Pressure Prediction
To study the effect of the kij, the bubble point pressure for a binary mixture of CO2 (1) and pentadecane (2) at 40 °C for a series of CO2 mole % in the liquid phase were predicted using the PR EOS in ProMax. First, the default value of the binary interaction in the data base (DB) of ProMax in which k12=0.0 was used.  The predicted results were compared with the experimental values and the average absolute percent deviation (AAPD) for eight data points calculated to be 41.06%. This AAPD was reduced to 1.64% when the binary interaction parameter of k12=0.112 was used. Figure 1 presents the effect of k12 on the predicted bubble point pressure of CO2 and pentadecane mixture. This figure demonstrates clearly the role of kij in improving the accuracy for bubble point pressure calculations. The improvement is substantial and the accuracy now is as good as the experimental data.

Figure 1

Similar improvement is observed when the binary interaction parameter, k12, was changed from zero, and the default value in data base (k12=DB) of ProMax, to 0.112 for the binary mixture of CO2 (1) and hexadecane (2) at 40 °C. For this case the AAPDs were 40.65%, 3.64% and 1.26% for k12=0.0, k12=DB, and k12=0.112; respectively.

For these two systems the liquid densities were also predicted and compared with the experimental values. For CO2and pentadecane binary system, the calculated AAPD for liquid densities were 6.10% and 6.36% for k12=0.0 and k12=0.112; respectively. Similar AAPD changes were observed for CO2 and hexadecane binary mixture.

Figure 2

Normally, the binary interaction parameters obtained from regressing binary mixture VLE data work well in multicomponent systems. This is demonstrated by using the same obtained kijs in a ternary mixture. The obtained binary interaction parameters of CO2 + pentadecane and CO2 + hexadecane were used without any further change to predict the bubble point pressure of the ternary mixtures of CO2 (1) + pentadecane (2) + hexadecane (3). Figure 3 indicates these binary interaction parameters obtained from the individual binary mixtures improve the accuracy of EOS considerably. Similar to the case of binary mixtures, when the binary interaction parameters, k12, k13, were changed from zero, and the default value of ProMax data base (kijs=DB), to 0.112 for the ternary mixture of CO2 (1) + pentadecane (2) + hexadecane (3) at 40 °C, the AAPDs were reduced from 40.99%  and 25.16% to 1.75%, respectively.

Discussion and Conclusions
It was shown that the binary interaction parameters of an EOS can be adjusted/tuned/regressed to improve the accuracy of VLE calculations considerably. It was also shown that when the regressed binary interaction parameters based on the binary experimental VLE data used without further changes in a multicomponent system considerable improvement in accuracy may be obtained.

It is a sound practice to check the accuracy of a selected thermodynamic package prior to running any simulation. However, experimental or field data are required to fulfill this task.

Figure 3

To learn more about similar cases and how to run process simulations, we suggest attending our G40(Process/Facility Fundamentals), G4 (Gas Conditioning and Processing) and G5 (Gas Conditioning and Processing – Special) courses.

By: Dr. Mahmood Moshfeghian

References:

  1. Peng, D.Y. and Robinson, D.B., “A New Two-Constant Equation of State,” Ind. Eng. Chem., Fundam., Vol. 15, No. 1, P. 59, 1976.
  2. ProMax, V. 3.0, Bryan, Tex.: Bryan Research & Engineering Inc, 2009.
  3. Tanaka, H., Yamaki, Y. and Kato, M., “Solubility of Carbon Dioxide in Pentadecane, Hexadecane, and Pentadecane + Hexadecane,” J. Chem. Eng. Data,38, 386-388,1993.

4 responses to “How to Tune the EOS in your Process Simulation Software?”

  1. IGLU says:

    Very good information. Lucky me I found your website by accident (stumbleupon). I’ve saved it for later!

  2. Muhammad Shehreyar Khan says:

    A very informal and articulate disquisition by Dr Mahmood. I’ve been very confused about EOS & it’s relationship with BIP. Now it’s crystal clear. Bundle of thanks again Dr. Mahmood. Best regards, Muhammad Shehreyar.

  3. userscripts says:

    I like this site so much, saved to fav. “To hold a pen is to be at war.” by Francois Marie Arouet Voltaire.

  4. I visited a lot of website but I believe this one has got something extra in it.

How sensitive are crude oil pumping requirements to viscosity?

During the life cycle of a crude oil pipeline the properties of transported oil change, because in gathering systems the produced oils come from different wells. New wells may be added or some wells may go out of production for maintenance and repair. Production rates during the life of wells vary, too. In addition the properties of crude oil change during production. Due to seasonal variation, the average line temperature may also change. As it is shown in the proceeding sections, viscosity of crude oil is a strong function of API gravity and temperature.

In the March 2009 tip of the month (TOTM), procedures for calculation of friction losses in oil and gas pipelines were presented. The sensitivity of friction pressure drop with the wall roughness factor was also demonstrated.

In this TOTM, we will study crude oil °API and the pipeline average temperature and how they effect the pumping requirement. For a case study, we will consider a 160.9 km (100 miles) pipeline with an outside diameter of 406.4 mm (16 in) carrying crude oil with a flow rate of 0.313 m3/s (170,000 bbl/day). The pipeline design pressure is 8.963 MPa (1300 psia) with a maximum operating pressure of 8.067 MPa (1170 psia). The wall thickness was estimated to be 6.12 mm (0.24 in). The wall roughness is 51 microns (0.002 in) or a relative roughness (e/D) of 0.00013. The procedures outlined in the March 2009 TOTM were used to calculate the line pressure drop due to friction. Then assuming 75 % pumping efficiency, the required pumping power was calculated. Since the objective was to study the effect °API and the line average temperature have on the pumping power requirement, we will ignore elevation change. The change in pumping power requirements due to changes in crude oil °API and line average temperature for this case study will be demonstrated.

Case Study 1: Effect of Line Average Temperature (Seasonal Variation)

To study the effect of the line average temperature on the pumping power requirement, an in house computer program called OP&P (Oil Production and Processing) was used to perform the calculations as outlined in the March 2009 TOTM. For a 35 °API crude oil in the pipeline described in the preceding section, the required pumping power was calculated for the line average temperature ranging from 21.1 to 37.8 °C (70 to 100 °F). For each case, the required pumping power was compared with an arbitrary base case (85 °F or 29.4 °C) and the percentage change in the pumping power requirement was calculated, accordingly. Figure 1 presents the percent change in power requirement as a function of line average temperature. There is about 5% change in the pumping power requirement for the temperature range considered.

Figure 1

Note as the line average temperature increases, the power requirement decreases. This can be explained by referring to Figure 2 in which the oil viscosity decreases as the temperature increases. Lower viscosity results in higher Reynolds (i.e. Reynolds number Equation is the ratio of inertia force to viscous force); therefore, the friction factor decreases (refer to the Moody friction factor diagram in the March 2009 TOTM).

Case Study 2: Effect of Variation of Crude Oil API
In this case, the effect of crude oil °API on the total pump power requirement for three different line average temperatures was studied. For each line average temperature, the crude oil °API was varied from 30 to 40 and the total pumping power requirement was calculated and compared to the base case (35 °API and average line temperature of 29.4°C=85°F).

Figure 2

Figure 3

For each case the percent change in total power requirement was calculated and is presented in Figure 3. As shown in this figure, when °API increases the total power requirement decreases. This also can be explained by referring to Figure 2 in which the crude oil viscosity decreases as ° API increases. The effect of viscosity is more pronounced at lower line average temperature (i.e. 21.1 °C or 70°F). Figure 3 also indicates that there is about 25 % change in total power requirement as °API varies from 30 to 40 °API. This is a big change and should be considered during design of crude oil pipelines.

Discussion and Conclusions
The analysis of Figure1-3 indicates that for the oil pipeline, the pumping power requirement varies as the crude oil °API changes. Increasing °API or line average temperature reduces the crude oil viscosity (see Figure 2). The reduction of viscosity results in higher Reynolds number, lower friction factor and in effect lower pumping power requirements.

In practical situations, an originating station takes crude out of storage and the midline stations taking suction from the upstream section of pipeline. In some parts of the world, the suction temperature to the originating pumps is +38 °C (+100 °F) but the temperature to the midline station is ground temperature (this assumes a buried line below the frost line) approximately 18 °C (65 °F). The originating station will always be more affected by temperature because storage will follow ambient – whereas the midline station will operate at notionally constant temperature +/- 5.5 °C (+/- 10 °F) in the lower 9 °C (48 °F). For the case studied in this TOTM, the number of pumping stations varied from 2.5 to 3.2.
In light of the above discussion, a sound pipeline design should consider expected variation in crude oil °API and the line average temperature.

To learn more about similar cases and how to minimize operational problems, we suggest attending our ME44 (Overview of Pumps and Compressors in Oil and Gas Facilities), ME46 (Compressor Systems – Mechanical Design and Specification)PL4 (Fundamental Pipeline Engineering)G40 (Process/Facility Fundamentals)G4 (Gas Conditioning and Processing), and PF4 (Oil Production and Processing Facilities) courses.

By: Dr. Mahmood Moshfeghian

12 responses to “How sensitive are crude oil pumping requirements to viscosity?”

  1. Bahjat Haddad says:

    Hello,
    I used Pipesim to simulate the same case:
    160.9 km (100 miles) pipeline with an outside diameter of 406.4 mm crude oil flow rate is (170,000 bbl/day). Wall thickness is 6.12 mm, wall roughness is 51 microns.

    You mentioned that the pipeline design pressure is(1300 psia) with a maximum operating pressure of (1170 psia). According to Pipesim, the back pressure is between 3115 and 3767 psia for 100 and 70 F which is way abovve the MAOP you mentioned. The landing pressure I used is 1 atm.

  2. AMATUZIO had ample opportunity to witness synthetic lubricants in action. API “SN” introduced October
    1st, 2010 matches ILSAC GF-5 fairly closely.
    This is why the old practice of changing straight grade oils to a
    heavier viscosity in the summer and a lighter viscosity in the winter is no longer necessary.

  3. Knowing the requirements and the choices you
    will have to make will give you a head start prior to enrolling in your certificate program.
    For instance, a school nurse gets a fixed salary with small yearly increases,
    but gets excellent benefits from the state
    or county that includes a generous vacation package and
    retirement plan. After all, what good is training if your news skills do not get used.

  4. Carlton says:

    Enhance the effect of an elliptical machine
    as a 24hr fitness trainer, by deciding upon a machine that also capabilities handlebars for a incredibly
    effective total human body exercise. Consult with your physician about doctor prescribed medicines and put together a support group.
    Get ready to become fit and have an amazing immune system that will make sure your visits to the doctor cue to illnesses are reduced
    significantly.

  5. You ought to be a part of a contest for one of the most useful sites online.
    I most certainly will recommend this blog!

  6. Hi there colleagues, how is everything, and what you want to say about this post, in my view its actually
    remarkable in support of me.

  7. Vengas Bong says:

    Listen up. This could certainly seem critical, but nevertheless I strongly tell you to reassess the things you just mentioned. I totally disagree with you. Email me at vengasbong@gmail.com

  8. I carry on listening to the newscast speak about getting free online grant applications so I have been looking around for the most excellent site to get one. Could you tell me please, where could i acquire some?

  9. Superb web site. Lots of valuable details here ISO Certification Consultants, ISO Certification Consultants Dubai uae Abu Dhabi, ISO 9001, ISO 27001, ISO 20000, ISO 14001, OHSAS 18001,ISO 17025, HACCP, ISO 22000, ISO 50001, EnMS, ISO Training Services, Management System Certification, ISO Consultant Dubai, ISO Certification Services in Dubai, ISO Consultants in Abu Dhabi, ISO Consultants in UAE, ISO 9001 Certification in Dubai, ISO Certification in Abu Dhabi, ISO Training Dubai, ISO 9001 Consultants in UAE, ISO 50001 Consultants in UAE, ISO 27001 Consultants in UAE, ISO 20000 Consultants in Dubai, ISO 22301 Certification in Dubai, ISO Certification Consultants in UAE, ISO 17025 Consultants UAE. Now i am sending the item to some associates ans moreover discussing with delectable. Not to mention, appreciate it on your hard work!

  10. I’m not sure why but this weblog is loading extremely slow for me. Is anyone else having this problem or is it a problem on my end? I’ll check back later on and see if the problem still exists.

  11. This design is spectacular! You certainly know how to keep a reader entertained. Between your wit and your videos, I was almost moved to start my own blog (well, almost…HaHa!) Fantastic job. I really enjoyed what you had to say, and more than that, how you presented it. Too cool!

Variation of Natural Gas Heat Capacity with Temperature, Pressure, and Relative Density

The change in enthalpy for a fluid where no phase change occurs between Points (1) and (2) can be expressed as:

Equation 1 (1)

The second term on the right hand side of this equation is generally not convenient to solve manually. However, it is trivial or zero for the following cases: (1) ideal gases, (2) constant pressure, dP = 0, and (3) for a liquid considered incompressible. For all three cases enthalpy is a mathematical function only of temperature. Cp is commonly expressed by equations of the form:

Equation 2 (2)

Where A, B, and C are constants that depend on system composition and T is the absolute temperature. In most instances it is sufficiently accurate to find a Cp at the average temperature TAvg, where:

Equation 3 (3)

CPAvg is then found at this average temperature and

Equation 4 (4)

This approximate solution to the first integral, although not exact, is satisfactory for most applications. Heat capacity values for pure substances are readily available from many handbooks and similar reference material. As noted in Chapter 7 of Volume 1, Gas Conditioning and Processing [1], values of heat capacity can be found from the slope of hvs. T plots at a given pressure. The CP for hydrocarbon liquid mixtures may be estimated from the equations presented in Volume 1 [1].
For a non-ideal, compressible fluid like natural gas, the second term on the right hand side of Eq.(1) can’t be ignored. Therefore, in process simulation software, an equation of state like Soave-Redlich-Kwong (SRK) [2] or Peng-Robinson (PR) [3] is used to calculate Deltah. For many calculations involving the heat capacity of natural gas, Figure 8.3 in Volume 1 is appropriate. Heat capacity at system pressure and average temperature is read off the graph and multiplied by gas mass flow rate and DeltaT to obtain the heat load, Q.

Equation 5 (5)

In this Tip of The Month (TOTM), the variation of heat capacity of natural gases with temperature, pressure, and relative density (composition) will be demonstrated. Then an empirical correlation will be presented to account for these variations. This correlation will be used to estimate natural gas heat capacity for wide ranges of pressure, temperature, and relative density. Finally, the accuracy of the proposed correlation will be discussed.

Development of a Generalized CP Correlation:

As mentioned earlier, CP can be defined from the slope of h vs. T plots at constant pressure. Mathematically, this is expressed by:

Equation 6 (6)

The derivative on the right hand side of Eq (6) may be obtained from an equation of state (EOS) but it is too tedious for hand calculations. Therefore, the PR EOS option in ProMax [4] was used to generate CP values for various values of pressure, temperature, and relative density. The total number of CP values calculated was 715. Table 1 presents the composition of five different natural gas mixtures used in this study.
Table 1. Gas compositions used for generating CP values

Table 1

Figures 1 through 5 present variations of CP with pressure, temperature and gas relative density. The red highlighted regions in Figures 3, 4, and 5 identify the two phase region of gas and liquid where the CP concept is not valid. It should be noted that the isobar of 20 MPa represents a single phase even at low temperatures. However, at low temperature, the fluid is dense phase.
In order to correlate all the curves shown in Figures 1-5 by a single equation, the following expression is proposed.

Equation 7 (7)

Where T is temperature, P is pressure and CP is heat capacity. A non-linear regression algorithm was used to determine the optimum values of parameters “a” through “f”. First, CP values of each gas in Table 1 were used to determine “a” through “f”. Then all of the generated CP values were used to determine a set of generalized parameters. These parameters were tuned and rounded to best represent all five gases covering a wide range of relative density from 0.60 to 0.80. For each case, the parameters and the summary of statistical error analysis are presented in Table 2. Note that the CP values of the two phase region were not used for the regression process. The general range of this correlation is from 20 to 200 °C (68 to 392 °F) and from 0.10 to 20 MPa (14.5 to 2900 Psia).

Figure 1

Figure 2

Figure 3

Figure 4

Figure 5

Discussion and Conclusions
A single and relatively simple correlation has been developed to estimate heat capacity of natural gases as a function of pressure, temperature, and relative density (composition). This correlation covers wide ranges of pressure (0.10 to 20 MPa, 14.5 to 2900 Psia), temperature (20 to 200 °C, 68 to 392 °F), and relative density (0.60 to 0.80). A generalized set of parameters in addition to an individual set of parameters have been determined and reported in Table 2. The error analysis reported in Table 2 indicates that the accuracy of this equation is quite good and can be used for natural gas heat duty calculations. For the generalized set of parameters, the average absolute percentage error (AAPD) and the maximum absolute percent deviations (MAPD) for the total of 715 points are 4.34 and 23.61, respectively. The applicable ranges of the proposed correlation are shown in Table 2.

Table 2. Parameters for the proposed correlation; Eq. (7) in SI and FPS system

Table 2

AAPD= Average Absolute Percent Deviation and
MAPD= Maximum Absolute Percent Deviation
NPT= Number of Points and
SG = Relative Density (Specific Gravity)
Note: Below the above the temperature ranges for pressures 2, 5, 7, and 10 MPa (14.5 to 1450 Psia), the gas mixture may be in two phase (gas and liquid) region.

It should be noted that the concept of heat capacity is valid only for the single phase region.

Figures 3 through 5 indicate that for low temperatures, liquid forms and irregular behavior of CP is observed.
To learn more about similar cases and how to minimize operational problems, we suggest attending our G40(Process/Facility Fundamentals), G4 (Gas Conditioning and Processing) and G5 (Gas Conditioning and Processing – Special) courses.

By: Dr. Mahmood Moshfeghian

Reference:

  1. Campbell, J. M., “Gas Conditioning and Processing, Vol. 1, the Basic Principals, 8th Ed., Campbell Petroleum Series, Norman, Oklahoma, 2001
  2. G. Soave, Chem. Eng. Sci. 27 (1972) 1197-1203.
  3. D.-Y. Peng, D.B. Robinson, Ind. Eng. Chem. Fundam. 15 (1976) 59-64.
  4. ProMax®, Bryan Research & Engineering Inc, Version 2.0, Bryan, Texas, 2007

5 responses to “Variation of Natural Gas Heat Capacity with Temperature, Pressure, and Relative Density”

  1. Ken D. says:

    My question is: As a recipient of natural gas in a factory setting, how can I monitor the BTU value of the gas being supplied to me. My conditions require that I create a very narrow heat range and I want to determine, with data, whether or not natural gas is sufficient for my needs.

  2. […] the July 2009 (TOTM) [2], a single and relatively simple correlation was presented to estimate real gas heat […]

  3. Jim Kumana says:

    Extremely useful information – a major problem given very little attention in college textbooks.

  4. Carlos Safont says:

    Great article, very useful for calculating polytropic compressors through Excel without relying on third party addins.

    Two questions about the formula:

    a) Is it extrapolable outside the 0.6-0.8 SG range?

    b) Does it work with other gases with a SG falling in the same range? (for example, 50% H2 + 50% H2S for a MW of around 19)

    Thanks again for the useful formula.

  5. Kofi says:

    Very impressive work. For my case I will zero in on a particular line for pressures between 32-36barg and temperatures from 22-27degC.

  6. mathias says:

    the heat capacity of liquid ethanol at 0 Celsius is 103.1 j/mol c. while at 100c the value is 158.8 j/mol c. use the data to derive an equation for estimating cp